Prior to Exchange Server 2010 Service Pack 1, errors in the database could be rectified using the ISINTEG tool. To do this, the database in question had to be offline. With Service Pack 1 for Exchange 2010, ISINTEG was replaced by a CMDlet in the Exchange Management Shell. The new CMDlet is called „New-MailboxRepairRequest“
and can be executed while the database is online. It is also possible to check only certain mailboxes in the database and correct errors. I describe how to do this in this article.
The following command is sufficient to check a database for errors:
New-MailboxRepairRequest -Database „Mailbox Database“ -CorruptionType ProvisionedFolder,SearchFolder,AggregateCounts,Folderview –DetectOnly
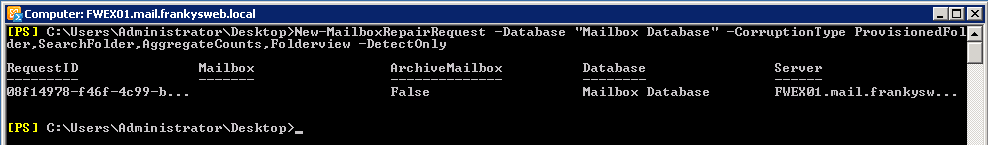

Der Befehl prüft die Datenbank „Mailbox Database“ und alle darin enthaltenen Postfächer auf Beschädigungen. Der Parameter -CorruptionType specifies which problems are to be searched for. The switch -DetectOnly indicates that errors are only logged, but no attempt is made to rectify the errors.
The following types can be used for the switch -CorruptionType must be specified:
SearchFolder = Check for damaged search folders
FolderView = Check views for folders that return incorrect content
AggregateCounts = Check for aggregated counter values for folders that display incorrect values
ProvisionedFolder = Check for shared folders that point to non-shared parent folders
If the parameter -DetectOnly Exchange attempts to rectify the errors found directly.
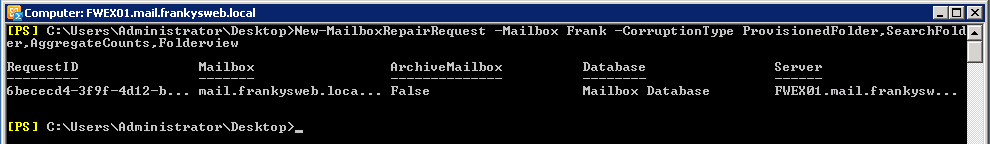
This command is sufficient to check only one mailbox for errors rather than the entire database:
New-MailboxRepairRequest -Mailbox Frank -CorruptionType ProvisionedFolder,SearchFolder,AggregateCounts,Folderview
To test the mailbox and archive, add -Archive:
New-MailboxRepairRequest -Mailbox Frank -CorruptionType ProvisionedFolder,SearchFolder,AggregateCounts,Folderview -Archive

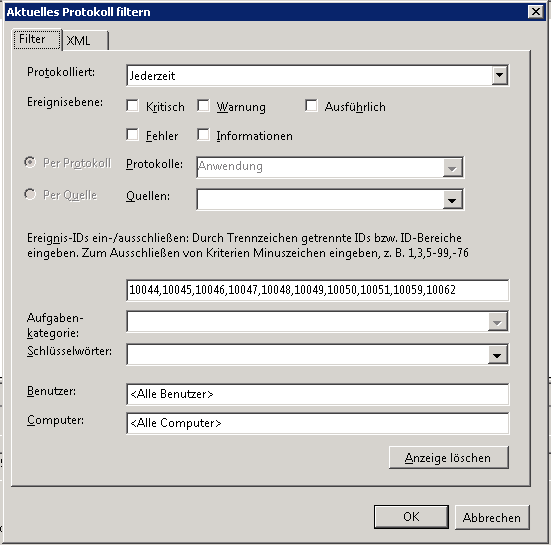
Once the command has been sent, the check can only be canceled by taking the database offline. The results of the check are logged in the server's application event log. The events have the following event IDs:
10044
10045
10046
10047
10048
10049
10050
10051
10059
10062
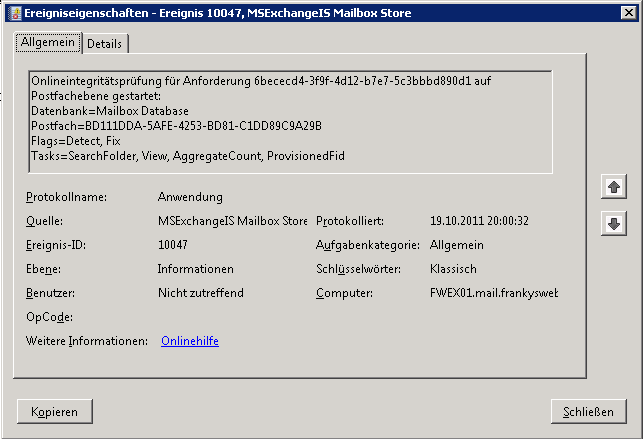
Example:

Das Anwendungs Log, lässt sich auf die entsprechenden IDs filtern, dazu einfach im Aktionsfeld auf „Aktuelles Protokoll filtern“ klicken und die ID eingeben