The positive feedback on Exchange Monitor 1.0 has encouraged me to develop Exchange Monitor further. I realized that the previous design is not very good for a small monitoring tool. I therefore decided to change the design and the concept for the data.
Here are the most important new features:
- Historical data
- Data is saved in CSV files
- Number of historical data configurable
- Dashboard
- New design, better overview
- Overall system status
- Detail pages
- Detailed status of the servers
- Integration Exchange Reporter
- Reports from Exchange Reporter can be displayed in Exchange Monitor
Of course, there are still alarm actions that are freely configurable (mail, SMS, etc.). The integration with Exchange Reporter requires version 2.1 of the Exchange Reporter. Version 2.1 is already in the starting blocks.
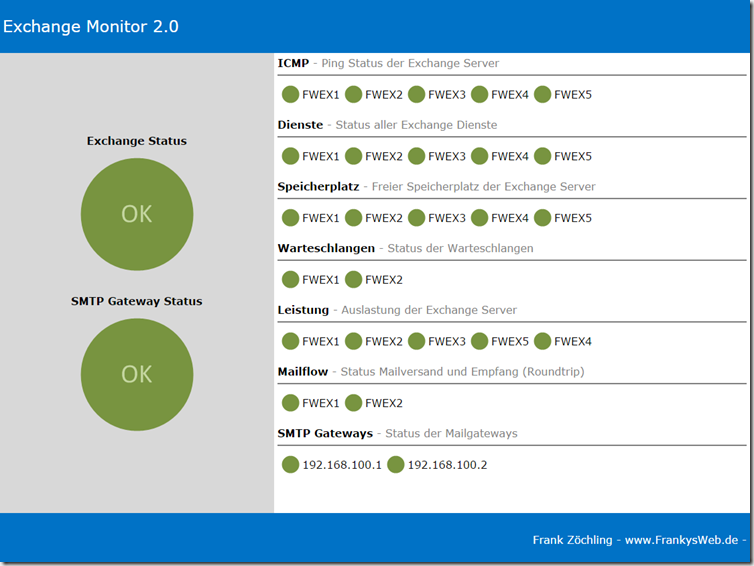
Enough writing, this is what the dashboard looks like: No jumble of data or lots of text. Green means OK, yellow is a warning, red is an error... This can be displayed wonderfully on a 55-inch TV on the wall ![]()
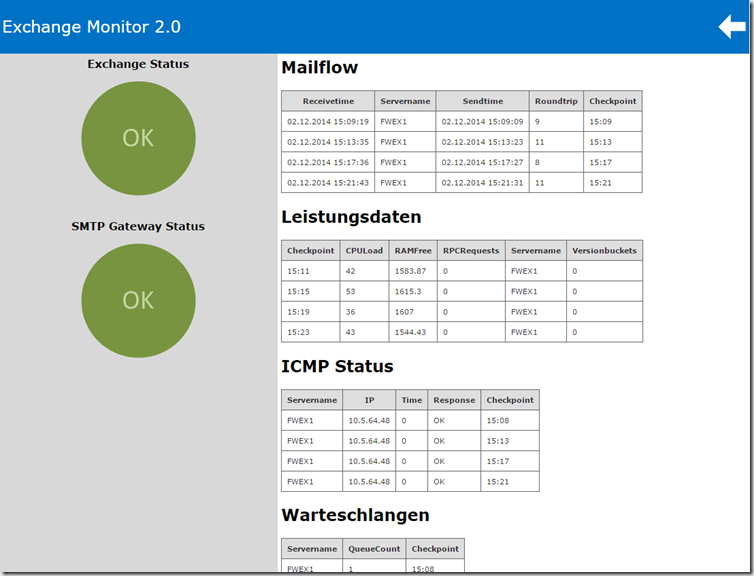
By clicking on the server, the data can then be displayed in detail as well as the previous data, which then looks like this:
I will gradually add more sensors. So far, everything that worked in Exchange Monitor 1.0 is working:
- Mail sending/receiving monitoring (sends a mail to the Internet and evaluates the response)
- Checks additional SMTP gateways if required (proxies, AntiSPAM gateways)
- Lists the queues and alerts you when queues are full
- Monitors the storage space of the Exchange Server
- Monitors the SMTP gateways via ping
- Monitors the Exchange services
- Can report errors via SMS
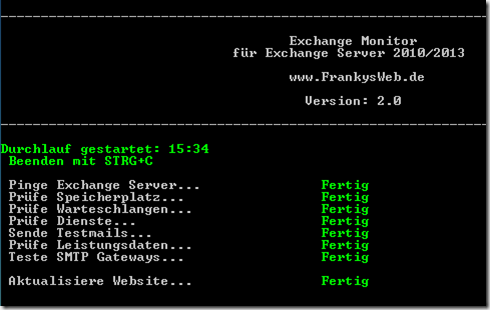
Installation is simple: download, unzip, customize settings.ini, start.
.\Start-ExchangeMonitor.ps1 -Installpath c:\ExchangeMonitor
The -Installpath parameter specifies the directory in which Exchange Monitor 2 is stored.
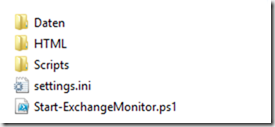
The following structure can be found in the directory:
After the first run, the "HTML" directory contains a file called "index.html", which can either be opened directly via a browser or an IIS is installed that points to this directory.
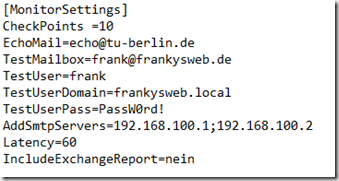
The "settings.ini" file can also be found in the Exchange Monitor directory. The corresponding settings must be made here before the first start:
- Checkpoints = Number of test points to be saved
- Echomail =Test mail with autoresponder for Mailflow (can normally be left as it is)
- Test mailbox =E-mail address from which the test mail is sent and received again
- TestUser =The user name associated with the test mailbox
- TestUserDomain =The associated AD domain in which the TestUser's account is located
- TestUserPass =Password of the test user
- AddSmtpServers =SMTP gateways to be checked that are accessible via SMTP port 25 (AntiSPAM gateways, proxies, etc.)
- Latency =Time in seconds in which the test mailbox must be found again within the mailbox, the value may have to be set higher or lower depending on the environment
- IncludeExchangeReport =As of Exchange Reporter version 2.1, it will be possible to display the Exchange reports in the monitor. Until then, please leave it at "no".
I will provide detailed instructions later. You can download Exchange Monitor 2.0 here:
Hallo,
bekomme jedesmal wenn ich das ausführen mag, bei Include-Functions einen Fehler wieso?