Jan Kappen has written a great HowTo on the subject of Grafana, InfluxDB and PowerShell. Jan describes the installation, configuration and use of Grafana and InfluxDB on his blog:
- Grafana, InfluxDB and Windows PowerShell - Part 1
- Grafana, InfluxDB and Windows PowerShell - Part 2
- Grafana, InfluxDB and Windows PowerShell - Part 3
- Grafana, InfluxDB and Windows PowerShell - Part 4
- Grafana, InfluxDB and Windows PowerShell - Part 5
For newcomers (like me) to Grafana and InfluxDB, this is the perfect HowTo.
At this point Many thanks to Jan! He drew my attention to a very exciting topic with his HowTo.
I have recreated Jan's environment. The test environment is installed in just a few minutes and can be fed directly with data.
Based on Jan's howto, I then started to feed the Influx database with data from Exchange Server and Sophos UTM. I was even able to use the scripts from my last Howto and only had to adapt them a little.
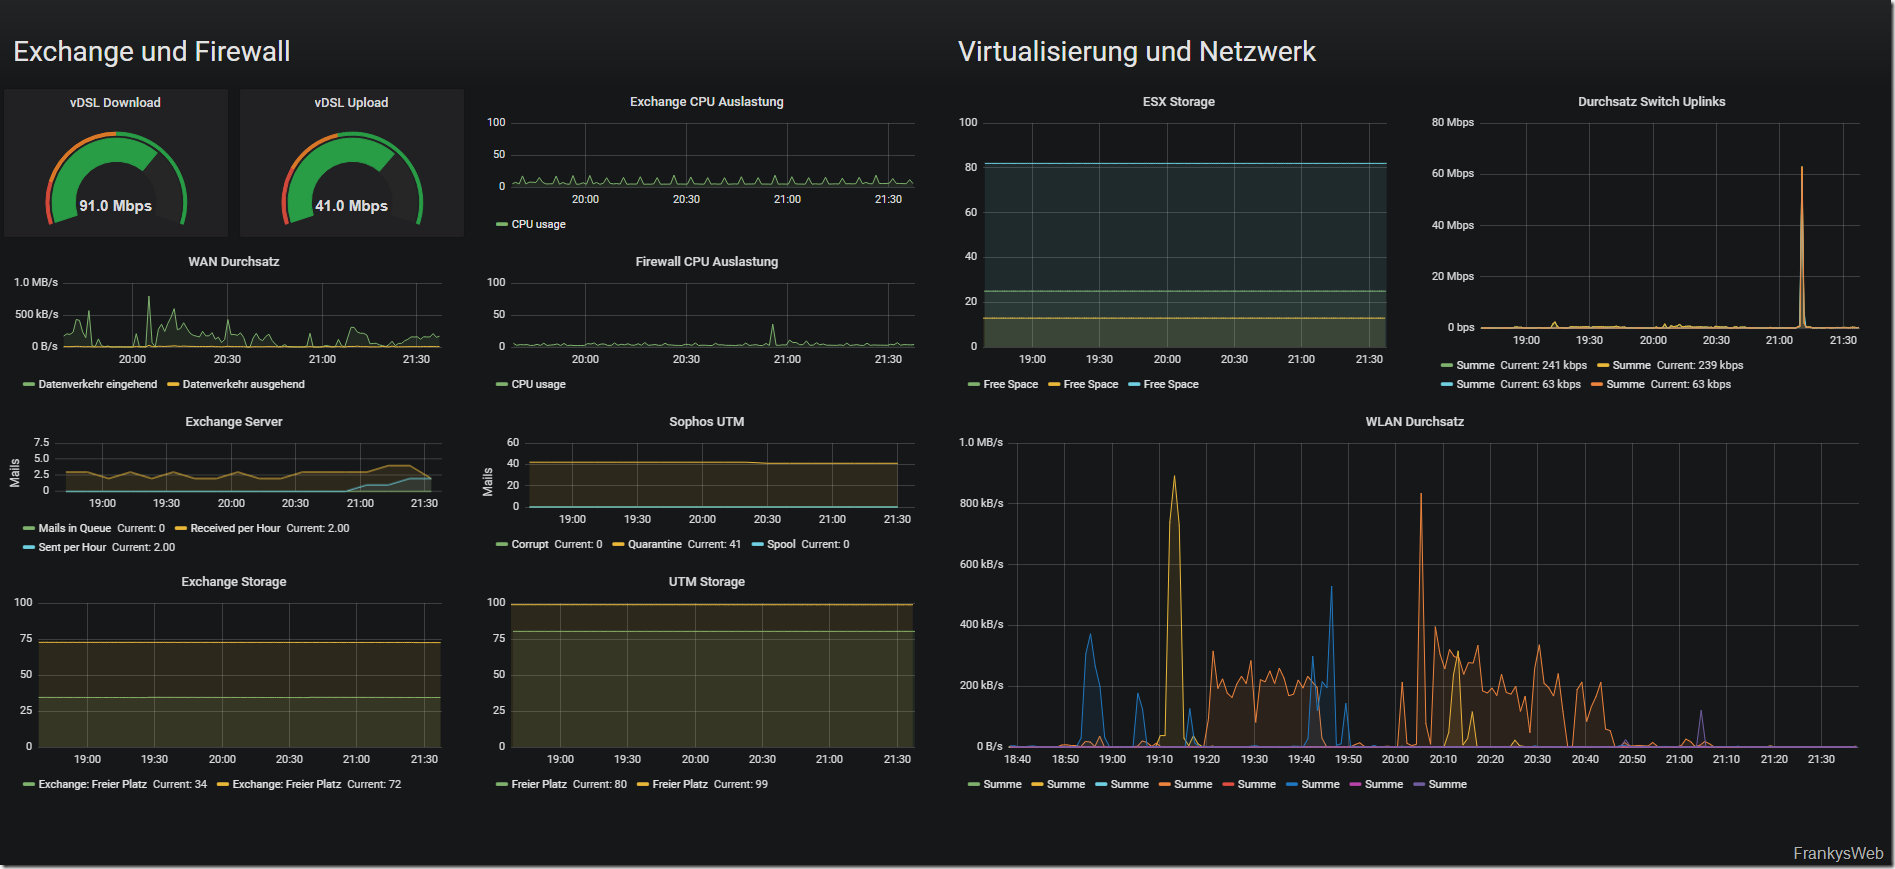
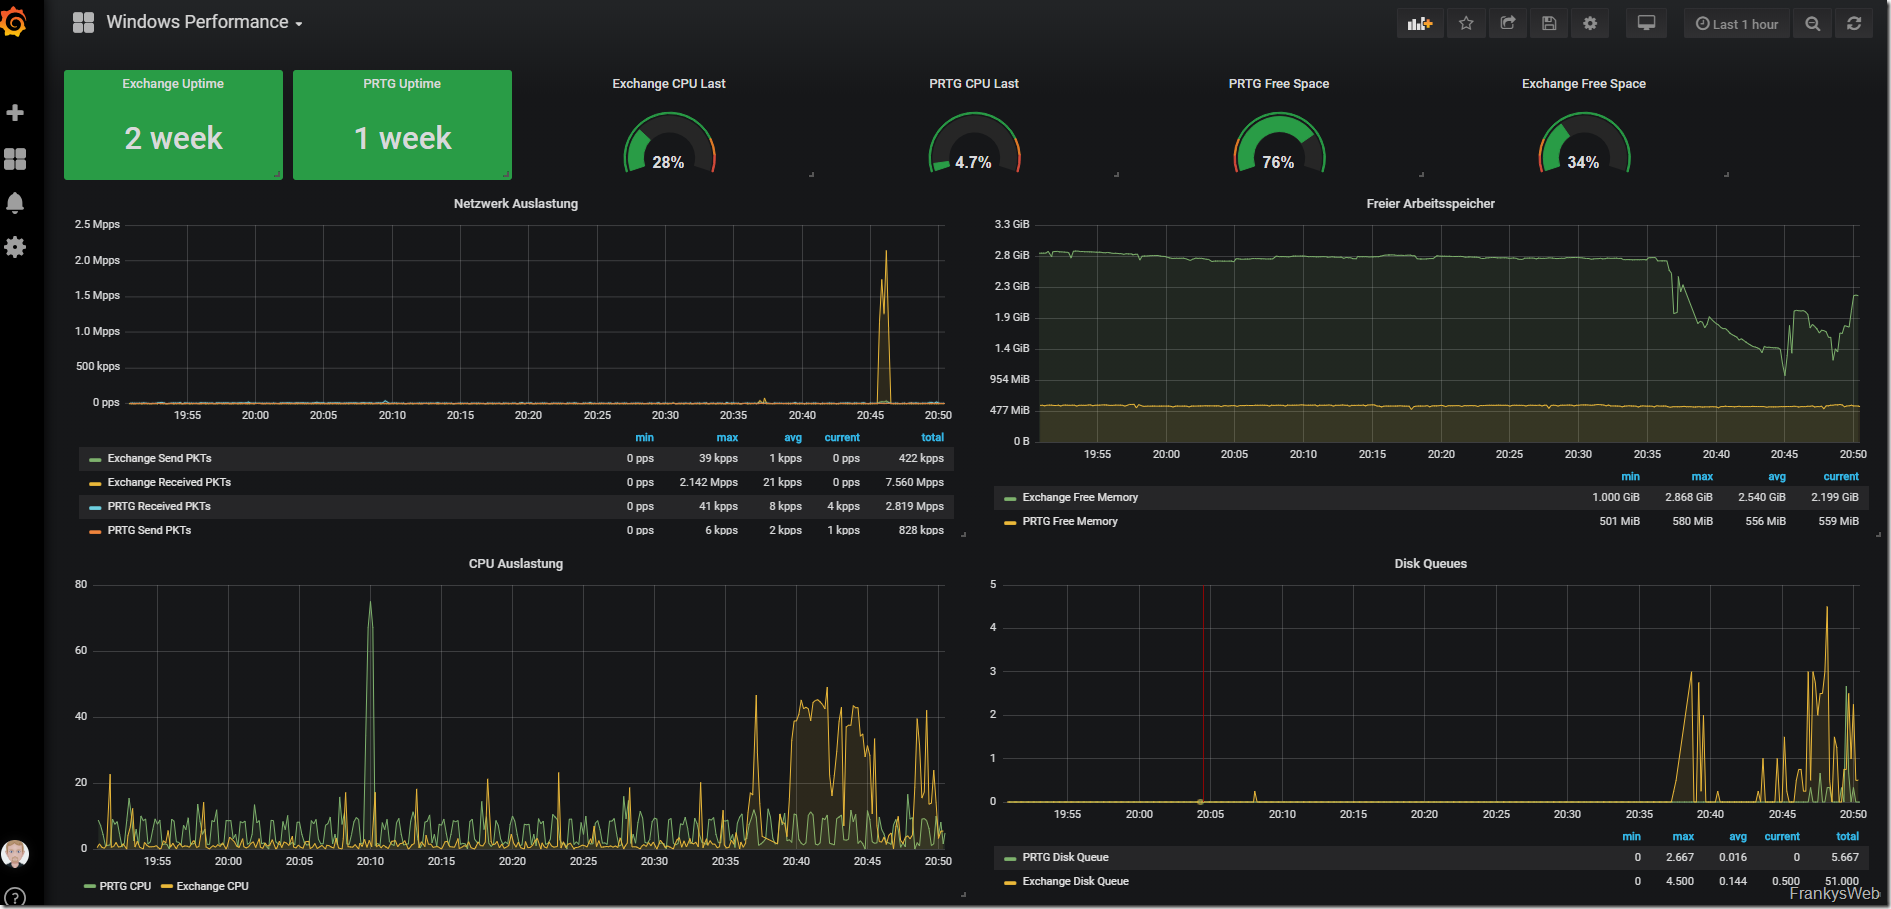
After a short period of familiarization and browsing through the system, I became aware that existing monitoring systems such as PRTG can also be integrated into Grafana. This is where things got very exciting for me, and this is my first draft of a dashboard:
The dashboard accesses PRTG and the InfluxDB. The following displays come from the Influx DB:
To write this data to the InfluxDB, I used Jan's example script and adapted it accordingly. I used the following script for the Exchange values:
while ($true){
$InfluxDBHost = "http://INFLUXDBSERVER:8086"
$IfluxDBName = "InfluxDBName"
$username = "influxusername"
$password = "password" | ConvertTo-SecureString -asPlainText -Force
$Cred = New-Object System.Management.Automation.PSCredential($username,$password)
$ExchangeServer = "Exchange"
#Exchange Snapin
Add-PSSnapin Microsoft.Exchange.Management.PowerShell.SnapIn;
$SendMailsPerHour = (Get-MessageTrackingLog -Server $ExchangeServer -EventId RECEIVE -Start (get-date).addhours(-1) | Where {$_.Source -eq "STOREDRIVER"} | select timestamp | measure).count
$ReceivedPerHour = (Get-MessageTrackingLog -Server $ExchangeServer -EventId DELIVER -Start (get-date).addhours(-1) | select timestamp | measure).count
$MailsInQueues = (Get-Queue -Server $ExchangeServer | where {$_.DeliveryType -ne "ShadowRedundancy"} | select messagecount | measure messagecount -Sum).sum
$metrics = @{
"Send per Hour" = $SendMailsPerHour
"Received per Hour" = $ReceivedPerHour
"Mails In Queues" = $MailsInQueues
}
$metrics
Write-Influx -Measure Exchange -Tags @{Server=$env:COMPUTERNAME} -Metrics $metrics -Database $IfluxDBName -Server $InfluxDBHost -Credential $Cred -Verbose
start-sleep 600
}
The UTM data is written to the InfluxDB with the following script:
while ($true){
$InfluxDBHost = "http://INFLUXDBSERVER:8086"
$IfluxDBName = "InfluxDBName"
$username = "influxusername"
$password = "password" | ConvertTo-SecureString -asPlainText -Force
$Cred = New-Object System.Management.Automation.PSCredential($username,$password)
$UTMHostNameorIP = "UTMDNSNAMEORIP"
$Loginuser = "loginuser"
$LoginUserPassword = "password"
$LoginUserPasswordSec = ConvertTo-SecureString $LoginUserPassword -AsPlainText -Force
$LoginCreds = New-Object System.Management.Automation.PSCredential($Loginuser,$LoginUserPasswordSec)
#Connect SSH Session
try {
$ConnectSSHSession = New-SSHSession -ComputerName $UTMHostNameorIP -Credential $LoginCreds -AcceptKey:$true
}
catch {
write-host "Can't connect to UTM"
}
#Query Quarantine
try {
$StrQuarantine = (Invoke-SSHCommand -Command "find /var/storage/chroot-smtp/spool/quarantine -type f | wc -l" -Index $ConnectSSHSession.SessionId).Output
[int]$Quarantine = [convert]::ToInt32($StrQuarantine, 10)
}
catch {
write-host "Can't query Quarantine mails"
}
if ($Quarantine -eq 1 -or $Quarantine -eq 0) {
$Quarantine = 0
} else {
$Quarantine = ($Quarantine -1)/2
}
#Query Output Queue (Spool)
try {
$StrOutput = (Invoke-SSHCommand -Command "find /var/storage/chroot-smtp/spool/output -type f | wc -l" -Index $ConnectSSHSession.SessionId).Output
[int]$Output = [convert]::ToInt32($StrOutput, 10)
}
catch {
write-host "Can't query Output (spool) mails"
}
if ($Output -eq 1 -or $Output -eq 0) {
$Output = 0
} else {
$Output = ($Output -1)/2
}
#Query corrupt queue
try {
$StrCorrupt = (Invoke-SSHCommand -Command "find /var/storage/chroot-smtp/spool/corrupt -type f | wc -l" -Index $ConnectSSHSession.SessionId).Output
[int]$Corrupt = [convert]::ToInt32($StrCorrupt , 10)
}
catch {
write-host "Can't query corrupt mails"
}
if ($Corrupt -eq 1 -or $Corrupt -eq 0) {
$Corrupt = 0
} else {
$Corrupt = ($Corrupt -1)/2
}
#Disconnect SSH session
$DisconnectSSHSession = Remove-SSHSession -Index $ConnectSSHSession.SessionId
$metrics = @{
"Quarantine" = $Quarantine
"Spool" = $Output
"Corrupt" = $Corrupt
}
$metrics
Write-Influx -Measure UTM -Tags @{Server=$UTMHostNameorIP} -Metrics $metrics -Database $IfluxDBName -Server $InfluxDBHost -Credential $Cred -Verbose
start-sleep 600
}
For the test run, the two scripts are still running as a loop, later I will probably simply execute the script cyclically using the task scheduler.
The remaining graphs come directly from PRTG. To do this, PRTG only had to be connected as a data source, which is described below.
I'm going to continue playing around with Grafana and InfluxDB for now. I can still think of countless possible applications...
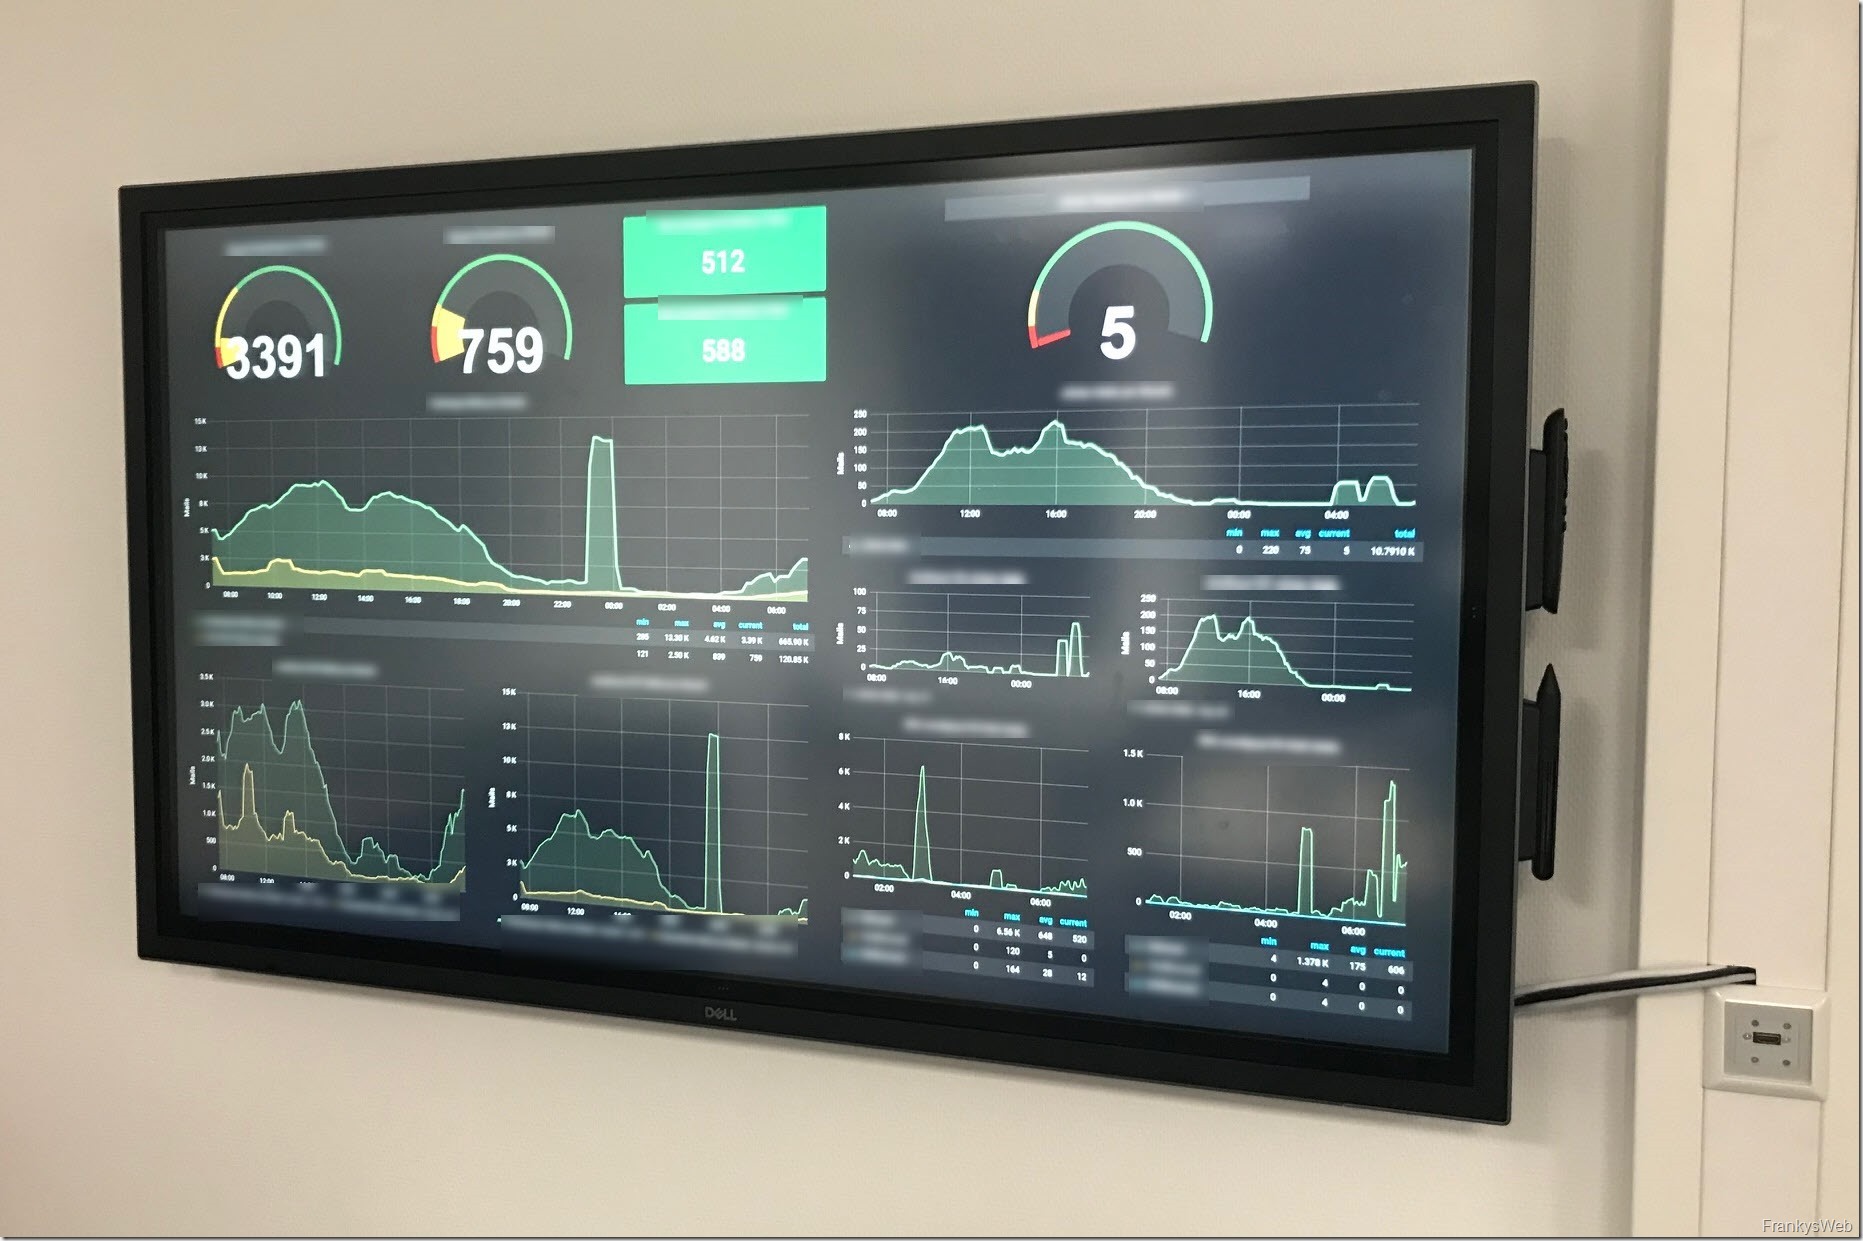
At least it looks very good in the office. It is very convenient that there is no reload of the page when the data is refreshed, so there is no "jerking" of the display:
Integration of PRTG in Grafana
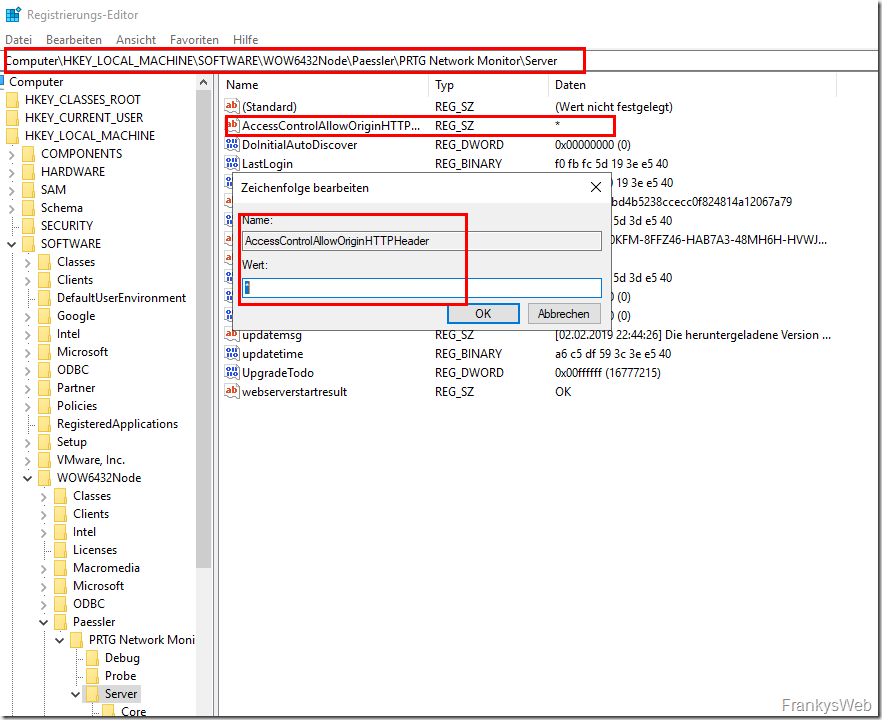
In order for PRTG to be used by Grafana as a data source, the following registry key must first be added to the PRTG server
- Path: HKEY_LOCAL_MACHINE\SOFTWARE\WOW6432Node\Paessler\PRTG Network Monitor\Server
- Name: AccessControlAllowOriginHTTPHeader
- Type: String (REG_SZ)
- Value: "*"
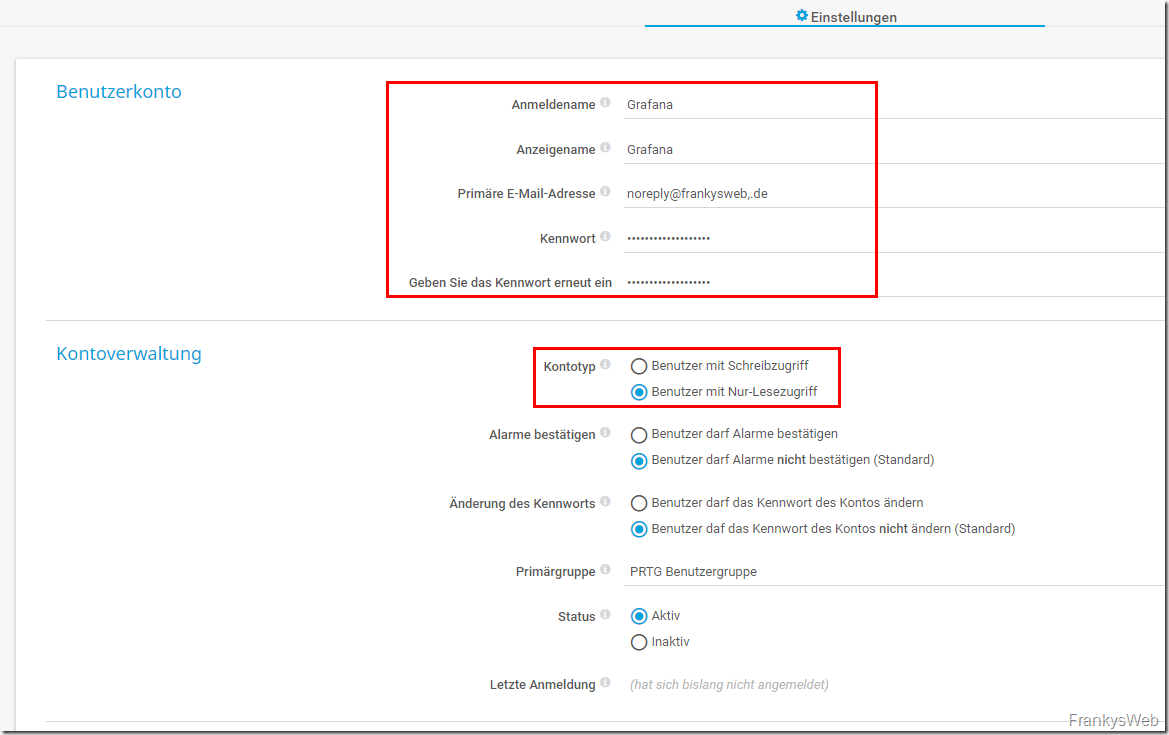
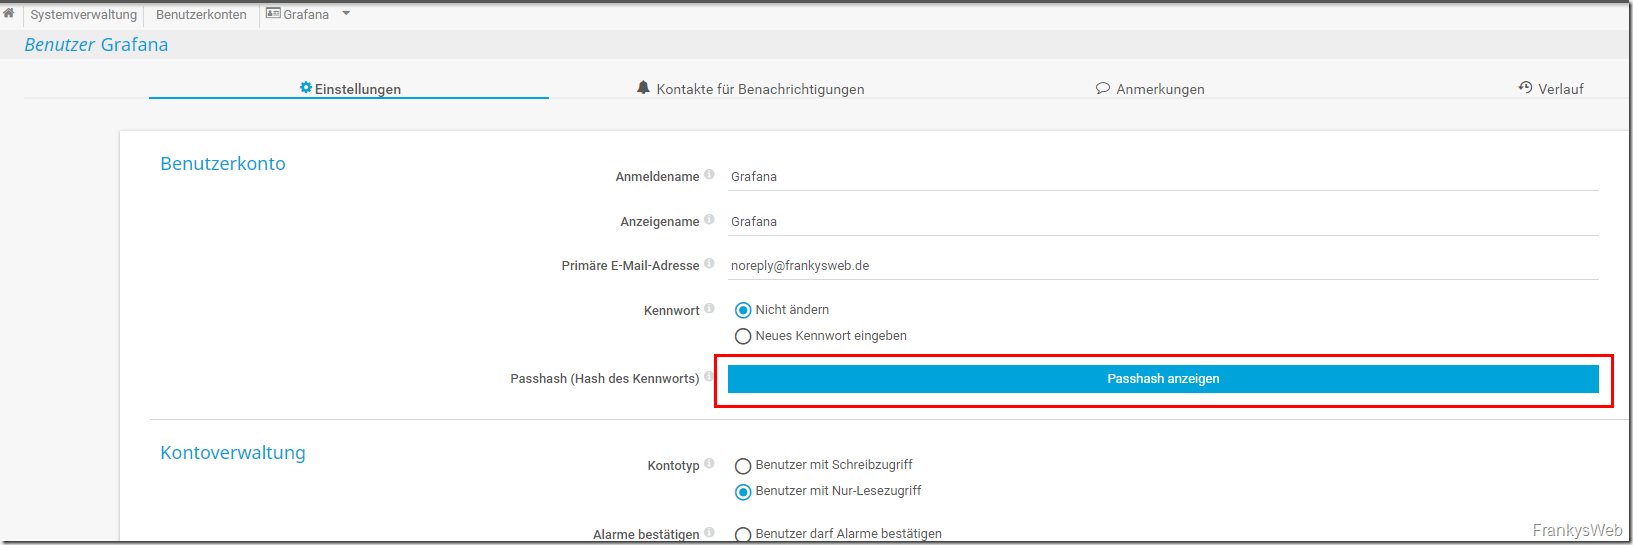
The PRTG Core Server service must then be restarted once. A PRTG user can now be created for Grafana:
After the user has been created, the hash of the password must be copied, the pass hash is used to set up the data source in Grafana:
It is best to log in to PRTG with the new user and check whether the user has read access to the devices and sensors, then the PRTG plugin for Grafana can be installed on the Grafana server, Grafana must also be restarted here first:
grafana-cli plugins install jasonlashua-prtg-datasource
service grafana-server restart
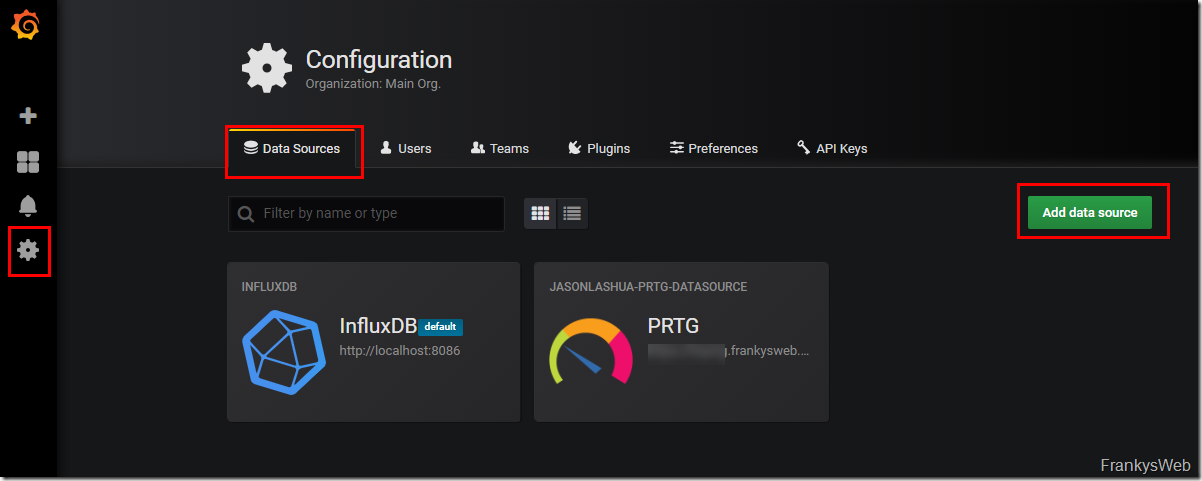
The connection to PRTG can now be configured:
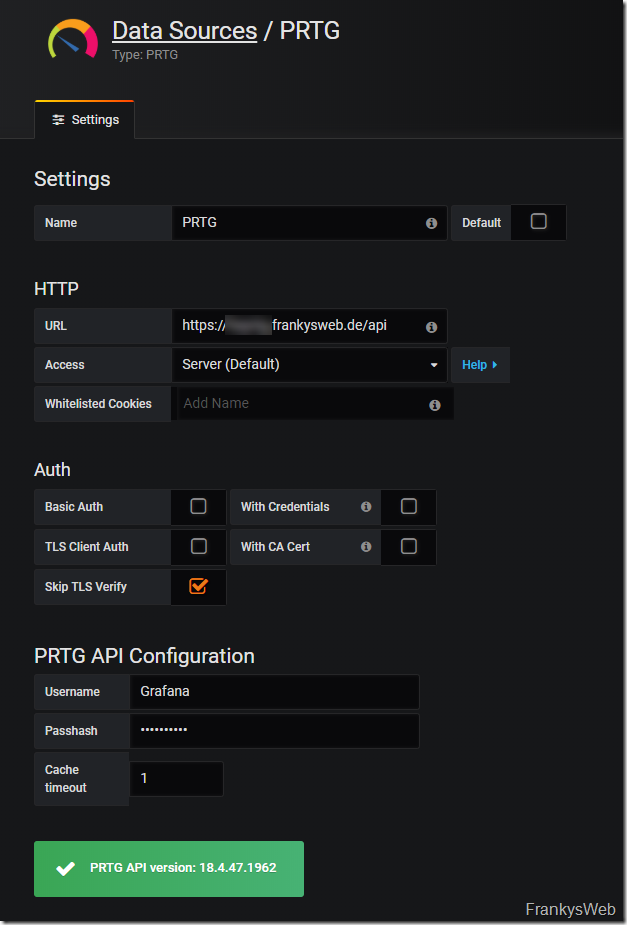
The corresponding settings are now required for the data source:
After clicking on "Save & Test", the corresponding PRTG API version is displayed. Grafana must be restarted so that data from PRTG can now also be displayed:
service grafana-server restart
Now you can also create graphs from the sensor data from PRTG and save the Windows performance data (CPU, RAM, network, disk) in InfluxDB with little effort.
Save Windows performance data in InfluxDB (Telegraf)
The "Telegraf" tool can send data from Windows, Linux and MacOS systems to the InfluxDB. The performance counters are particularly interesting for Windows systems.
In order to send the most common performance data from Windows systems to InfluxDB, the Telegraf must first be downloaded:
The two files from the ZIP archive can now be saved under C:\Program Files\Telegraf on the Windows system that is to send its performance data to InfluxDB:
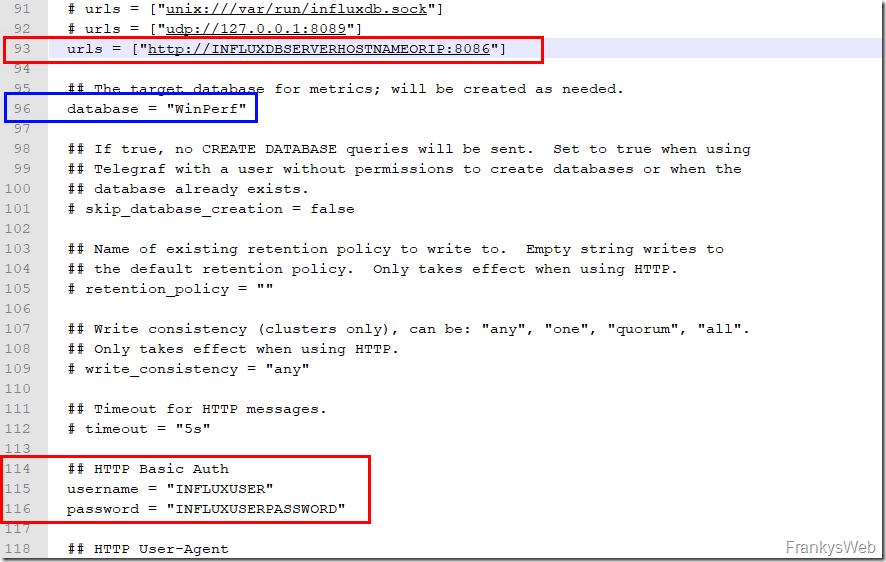
The Telegraf.conf file can then be edited, I have found a corresponding example configuration which can be downloaded here. In the following .conf file, only lines 93, 115 and 116 need to be adapted:
The sample configuration can be downloaded here:
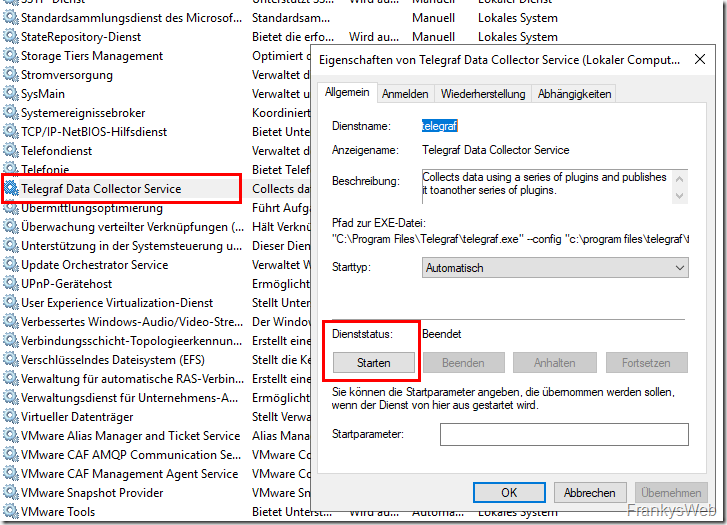
Telegraf can then be created as a Windows service:
telegraf.exe --service install -config "c:\program files\telegraf\telegraf.conf"
The service can now be started:
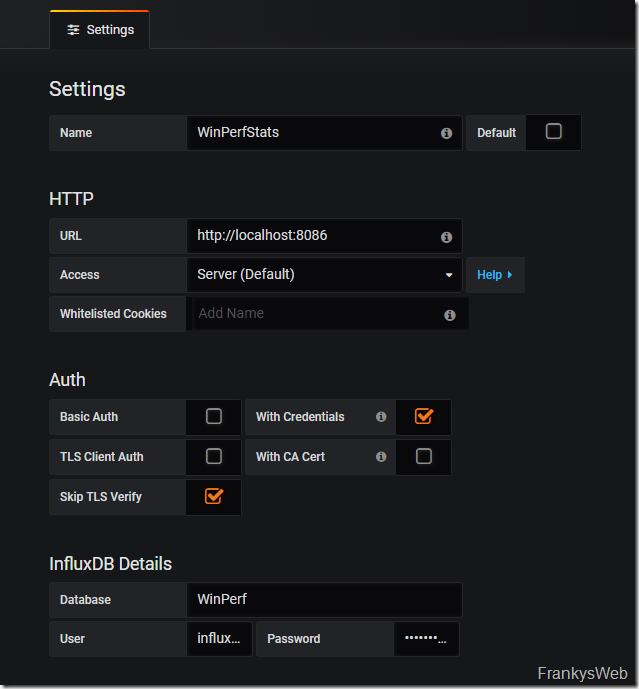
Telegraf now stores the performance data in the Influx database "WinPerfStats" (see above, blue box). I found it a little easier to create a new database for the performance data. If you do not want to do this, you can also use an existing database (the new database does not have to be created separately, Telegraf takes care of this).
The new Influx database can now also be added as a data source:
As soon as the new database is integrated, it can also be used to build smart dashboards:
Tidying up the InfluxDB
After some tests, some data garbage ends up in the InfluxDB, but this can be easily cleaned up, here are a few simple commands for cleaning up.
Show databases:
- show databases
Select database:
- use DBNAME
Delete database:
- drop database DBNAME
Show Measurements:
- show measurements
Delete Measurements:
- drop measurement NAME
Here is a good overview of the most important commands and actions:
Database management using InfluxQL



Sehr cool nur leider wird das PRTG Plugin für Grafana nicht mehr aktiv weiterentwickelt :( Das hindert mich aktuell daran Grafana mal auf der Arbeit zu implementieren :(
Alle wege führen zu Frank… unbeirrt am forschen und entdecken von node-red und grafana, bin ich mal wieder hier gelandet. :o)
Danke Frank für die viele guten Artikel.
Hallo Frank,
könntst Du bitte Dein erstes Dashboard mit mir teilen? Ich schreibe die Informationen meines Exchanges erfolgreich in die influxdb, schaffe es aber nicht, mein dashboard so zu gestalten, dass die Metriken
„Send per Hour“ = $SendMailsPerHour
„Received per Hour“ = $ReceivedPerHour
„Mails In Queues“ = $MailsInQueues
angezeigt werden (die aus dem angepassten Skript von Jan) Eventuell hast du sogar ein umfassendes Exchange Dashboard mit passender telegraf Konfiguration rumliegen? Du würdest mir mit allem sehr helfen =)
Vielen Dank im Vorraus,
Sebastian
Vielen Dank für diesen wirklich super Artikel. Habe mir ein Dashboard gemacht um Exchange, SCCM und einige AD Informationen zu überwachen. Hat man viel schneller alles wichtige im Blick als mit SCOM.
Hi Frank,
wie hast du das gelöst mit der Data Rate zwischen Grafana und PRTG?
Ich bringe die Werte bei Grafana nicht heraus.
Hi Manuela,
da hab ich nichts spezielles gemacht, nur nach dem anlegen der Datasource noch einmal den Grafana Service neugestartet. Da hat es direkt funktioniert.
Gruß,
Frank