Unfortunately, Exchange Server does not offer a build-in option to clearly display the status of the environment or certain performance parameters on a dashboard. Even many monitoring tools quickly reach their limits here when it comes to clearly displaying the number of emails received or sent, for example.
In this series of articles, I would therefore like to present ELK, or the Elastic Stack, as a possible option for dashboards in conjunction with Exchange Server.
Perhaps someone can also do something with it, or report on their experiences.
Introduction
I recently had a Articles about dashboards and Exchange Server. Thanks to a series of articles by Jan Kappen, I became aware of the topic of Grafana and InfluxDB and have adapted it accordingly for Exchange Server. In my small home environment, this also runs absolutely reliably with a few small PowerShell scripts that store the data in the InfluxDB. The scripts evaluate the message tracking logs, for example, and send the corresponding values to the InfluxDB.
In a larger environment, however, searching the Exchange message tracking logs and saving the data in InfluxDB works rather suboptimally. One of the causes: Searching the message tracking logs via PowerShell (get-messagetrackinglog) and processing them is simply far too slow. In addition, the corresponding scripts have to run at intervals and therefore always involve a certain "fuzziness" due to the runtime (overlapping of the runtime or "blind spots").
I have therefore been looking for a way to get the following problems under control:
- Get-MessagetrackingLog is very slow with large amounts of data (e.g. large time period and large volume of mail)
- Some blurring in the data due to long script runtime and increased system load
Nevertheless, I naturally wanted smart dashboards on the current status of the Exchange servers.
I then somehow got stuck with the ELK stack (Elastic Stack), as I had identified further possibilities and use cases here. More on that in a moment.
What is ELK?
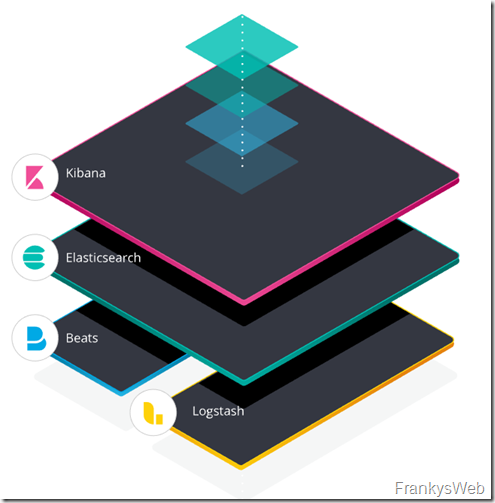
ELK, or the Elastic Stack, essentially consists of four components:
- Elasticsearch: A "search engine" that makes large amounts of data, such as logs, searchable
- Logstash: Receives logs and data, prepares the data and stores it in Elasticsearch
- Kibana: The graphical front end to Elasticsearch
The new name of ELK is actually Elastic Stack, because a fourth component has now been added to the three already mentioned:
- Beats: Collects data on source systems and transfers it to Elasticsearch
BELK or KELB somehow doesn't sound so nice, so it is now simply called Elastic-Stack.
Further information can be found here:
My use cases
My motivation for this series of articles is as follows:
- I would like to have a system that makes it possible to search the Exchange message tracking logs as quickly as possible. Anyone who has ever had to evaluate the message tracking logs in a larger environment over a longer period of time knows what I mean.
- I would like to create different dashboards for different user groups. As an admin, it is important to have an overview of the current status in order to be able to recognize problems at an early stage, while other users are interested in completely different metrics. For example, how many emails have been sent to a support address.
- I would prefer to have the data from all mail gateways in one interface so that I don't have to check on the various gateways whether the mail has been received and what has happened to it.
This is essentially what I want to achieve in the first instance. Server performance data or event logs are not the focus here for the time being. So you could see it as a small isolated solution for message tracking.
Notes on this series of articles
The system requirements for the Elastic Stack are significantly higher than for a Grafana / InfluxDB installation. While InfluxDB and Grafana can be operated with very few resources, the situation is quite different with the Elastic Stack.
However, I would compare apples with lemons at this point. Although modern dashboards can be created with Grafana and Kibana, the functionality and the approach are different. In terms of the end product "dashboard", Grafana and Kibana can deliver similar results, but Elastic Stack and "Grafana with InfluxDB" can hardly be compared with each other here. These are simply two completely different products, I think this will become a little clearer in the following articles. The reference should simply serve as a differentiation, as I mentioned Grafana at the beginning. Which way you choose is up to you. After all, this is just one of many.
The exciting parts will follow when they are ready...

Super Thema und ich hoffe auf eine Fortsetzung zu diesem Thema. Wir verfolgen das Ziel die Scan2Mail Systeme aus den Logs später auslesen zu können da es bei Exchange 2016 nicht mehr so einfach ist als bei Exchange 2010.
haben wir bei uns schon lange so im Einsatz. Funktioniert perfekt. Was auch noch laufen würde wäre Graylog. Macht in vielen Dingen das selbe wie der ELK Stack.
Der Anfang klingt schon vielversprechend – ich freue mich auf die Fortsetzung!