In Part 3 of this article series I have described the configuration of the ELK components. If someone has already rebuilt the environment up to this point, there should already be some data records from the Exchange message tracking logs in the Elasticsearch instance.
Introduction
This article is about creating a simple Kibana dashboard that displays initial data from the message tracking logs.
Create and save the first filter / search
In order for data to be displayed on a dashboard, the relevant data must first be found. If only the Exchange message tracking logs are available in Elasticsearch, this is still relatively simple.
Here is an example of how to obtain the relevant data.
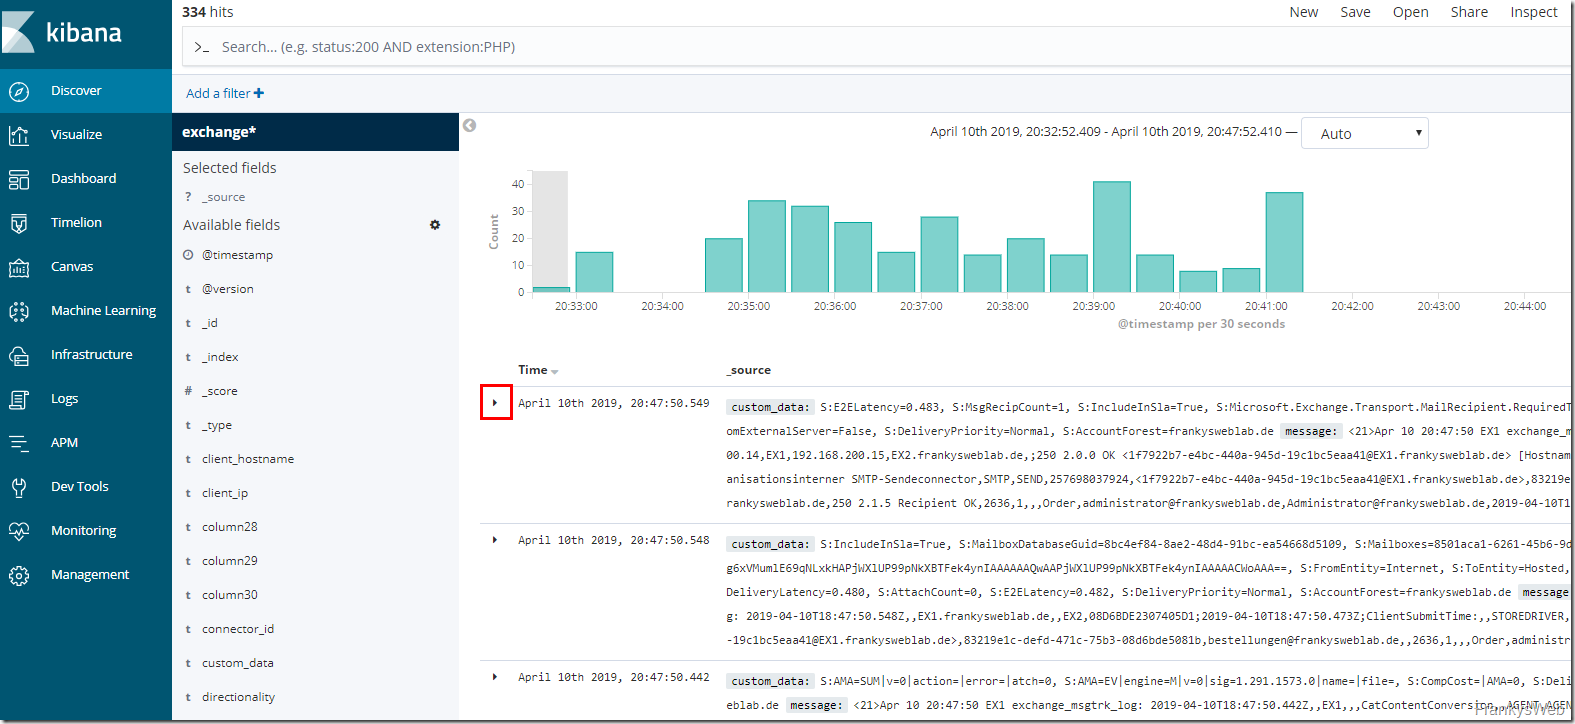
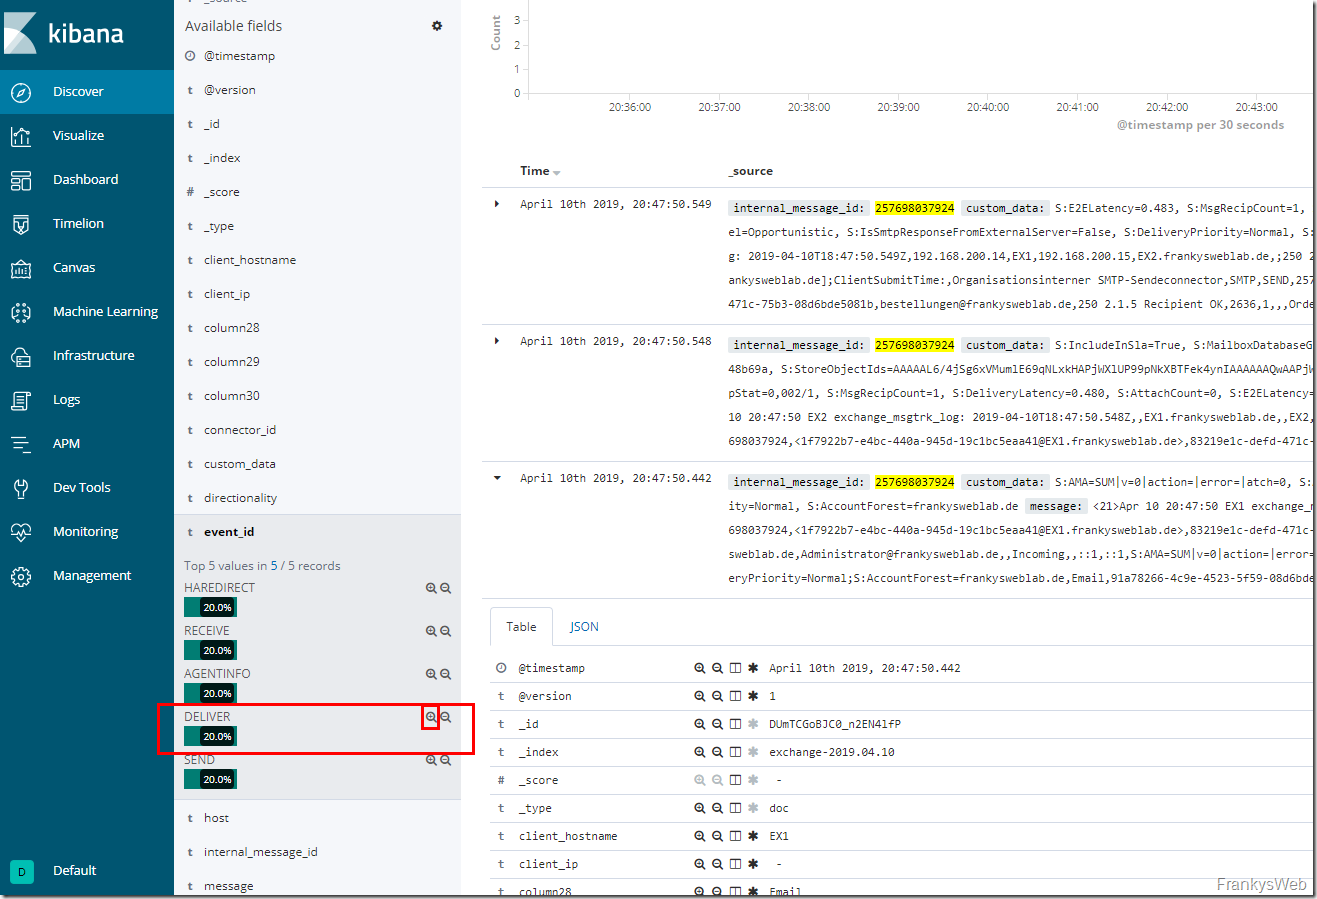
First of all, I would like to display the number of mails delivered to the mailboxes. The data from the message tracking logs must therefore first be filtered. To get an overview of the data for a mail, I first look for a single mail. The easiest way to identify a single mail is by its MessageID. To get the MessageID, click on the small triangle in front of a log entry:
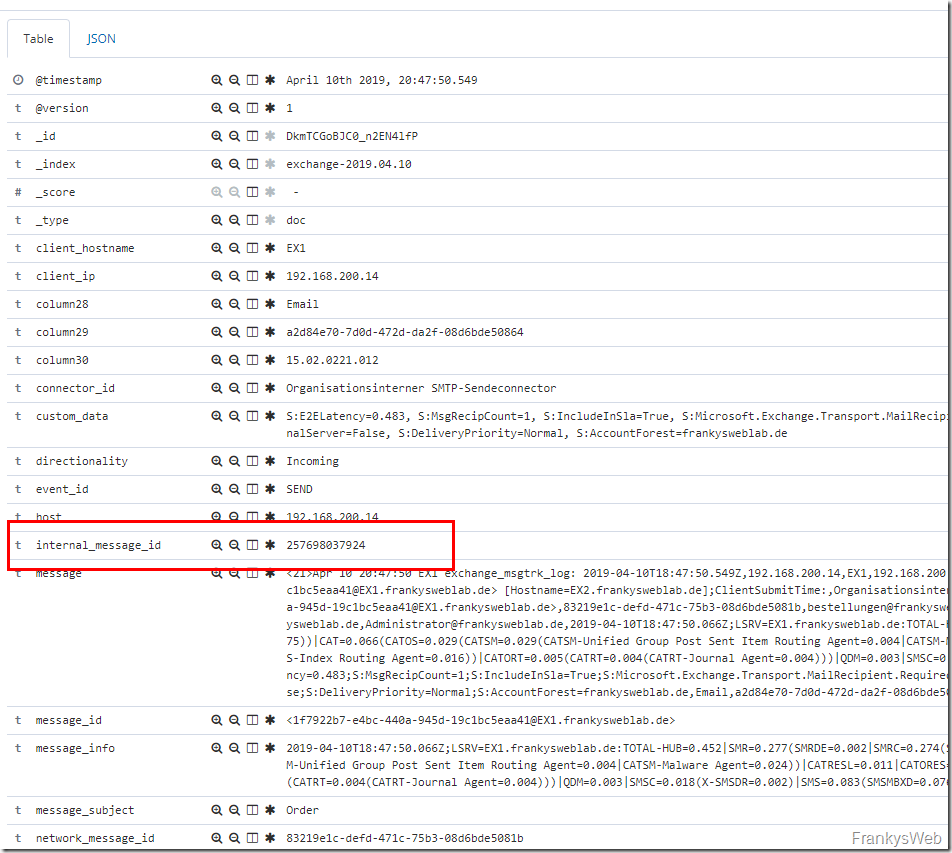
All data for this event is now displayed, including the "internal_message_id" entry. The value for the "internal_message_id" is now copied:
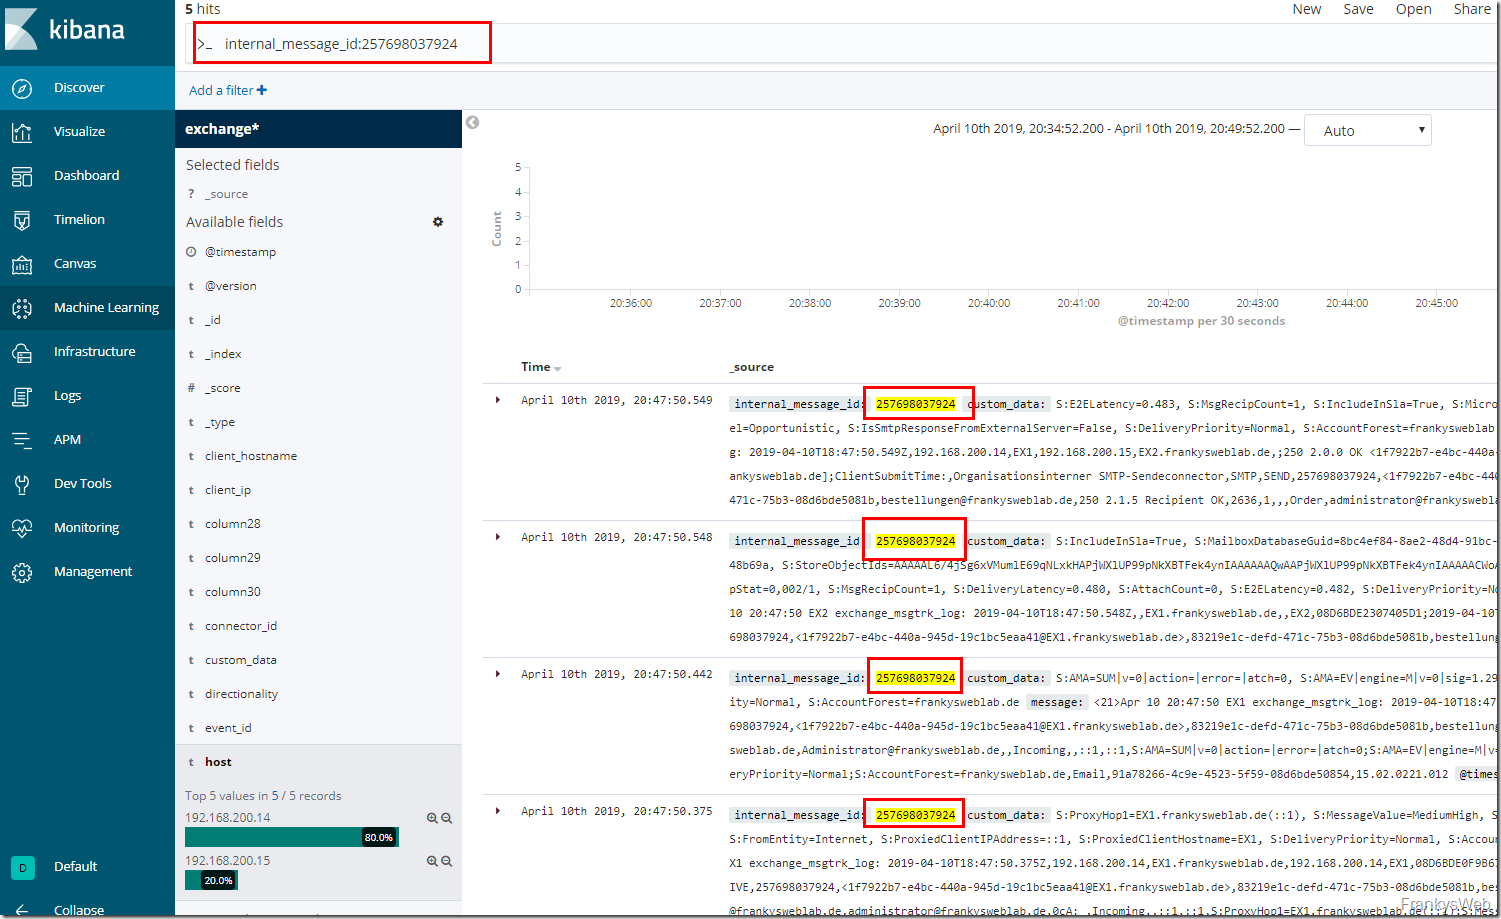
You can now search for exactly this MessageID in the logs. To do this, the following search string is entered in the :
internal_message_id: "ValueOfMessageID"
All entries for the individual mail are now displayed:
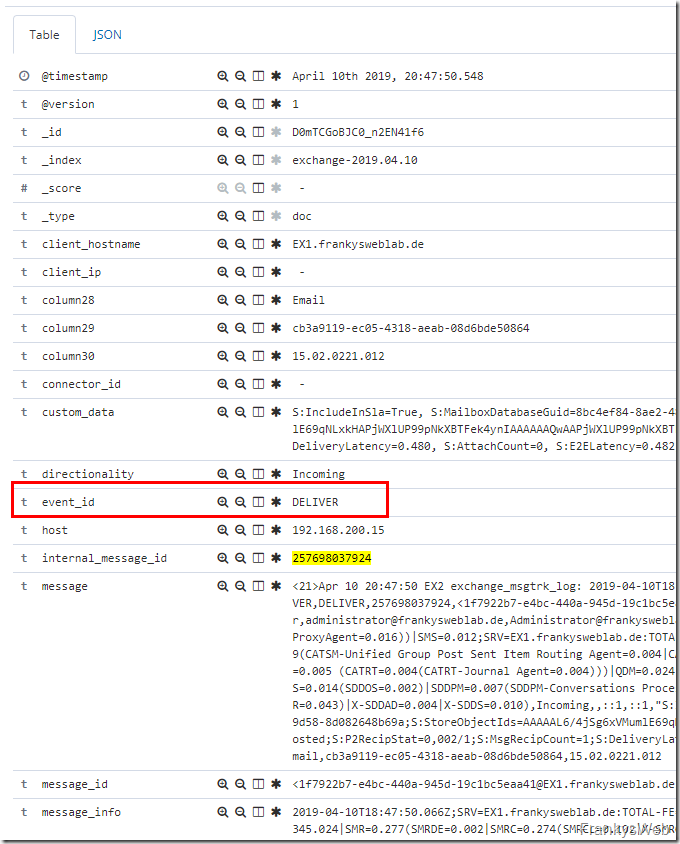
The log entry with the Event_ID "Deliver" can now be searched for from the entries for the individual mail. Deliver is the event that is generated when a mail is delivered to a mailbox.
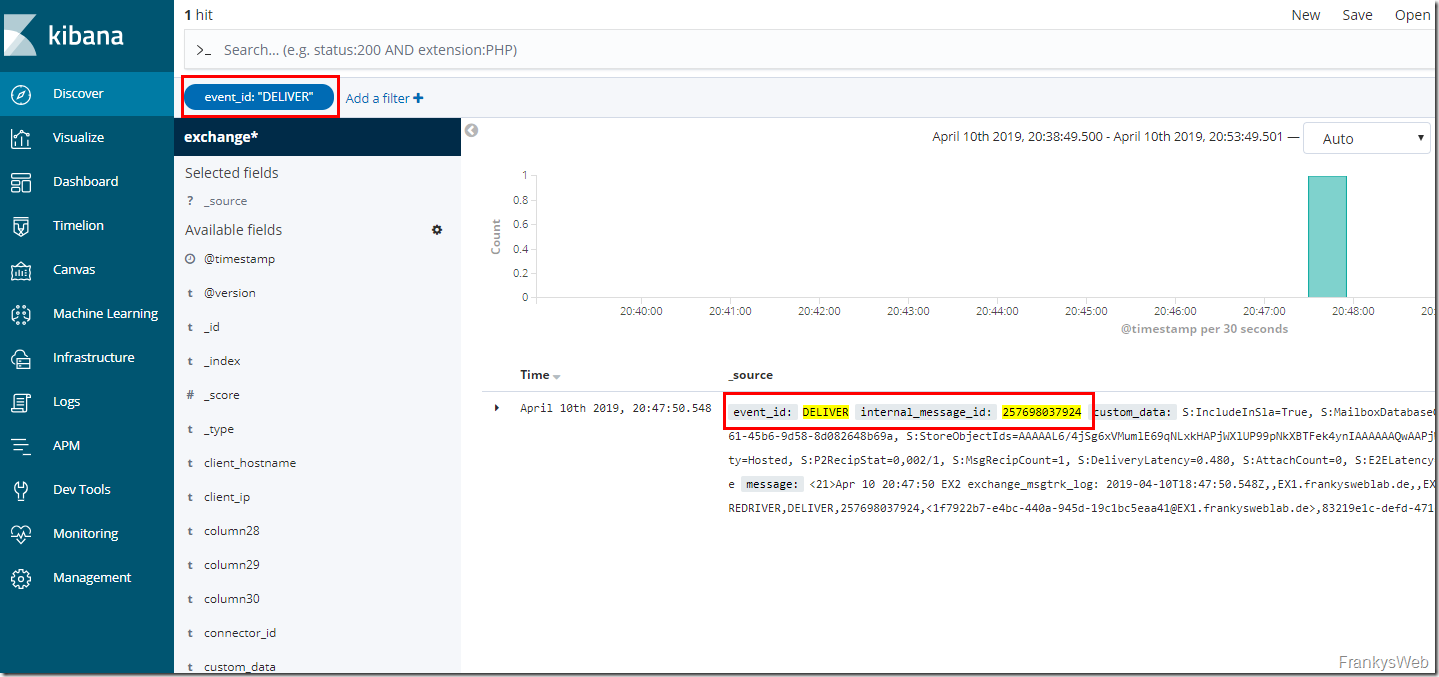
The "Deliver" event can now be added as a filter; now only log entries that correspond to the previously selected MessageID and the Deliver event are displayed:
In this case, only one log entry is displayed:
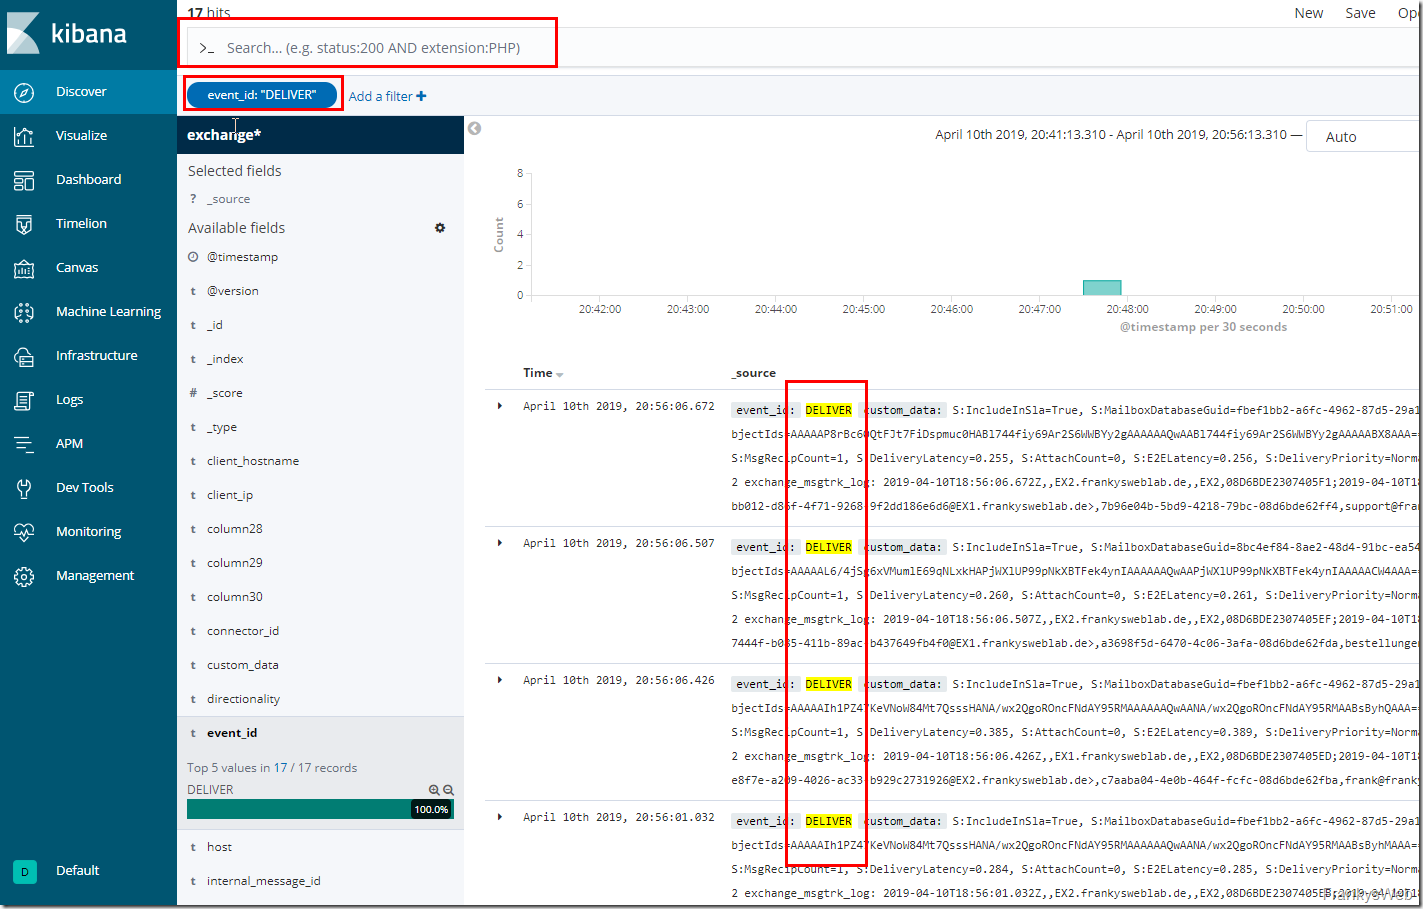
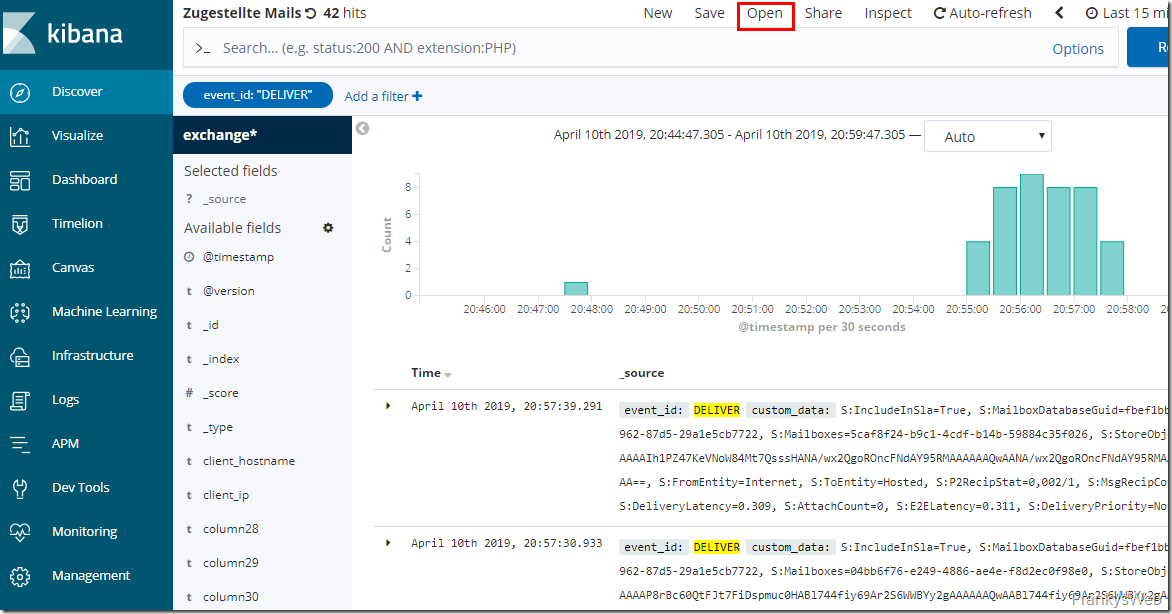
The previously set search filter ("internal_message_id") can now be deleted, but the filter for the Event_ID "Deliver" is retained. All log entries with the event "Deliver" are now displayed in the overview:
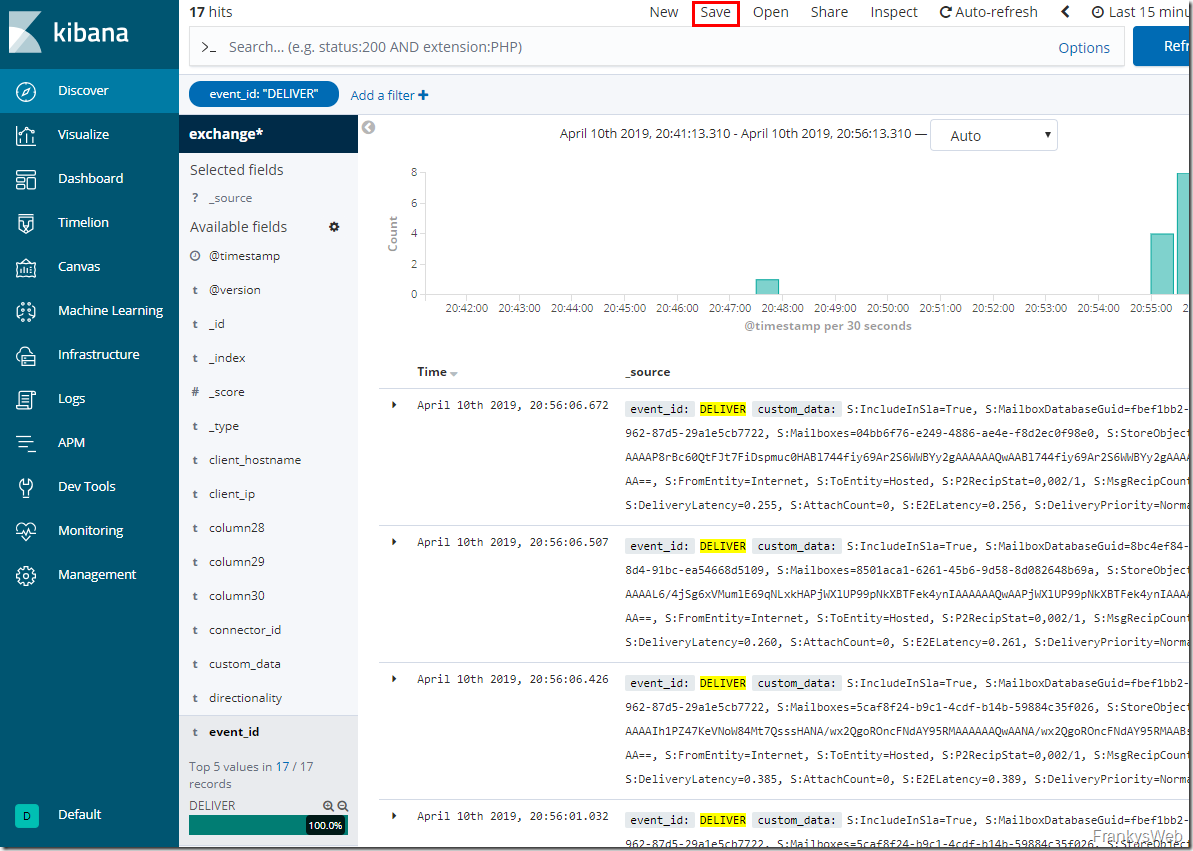
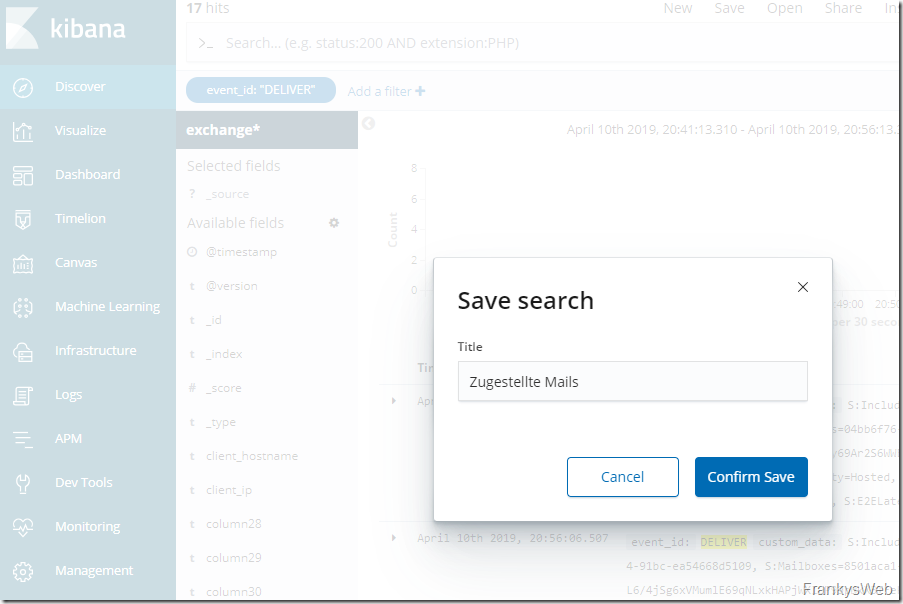
You can now see all mails that have been delivered to mailboxes. The search for delivered mails can now be saved:
For example, the name "Delivered mails" can now be used here:
The previously set search can be called up again using "Open":
In this way, log entries can be filtered for a variety of other parameters.
Unfortunately, this is not always as easy as with the delivered mails, but for the first visualization this is enough.
Create visualization
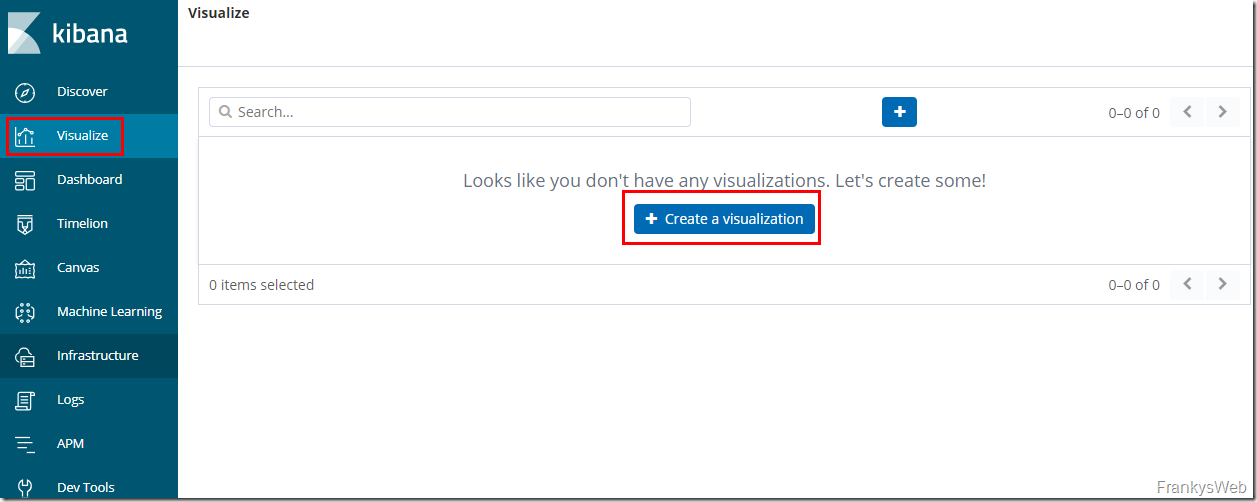
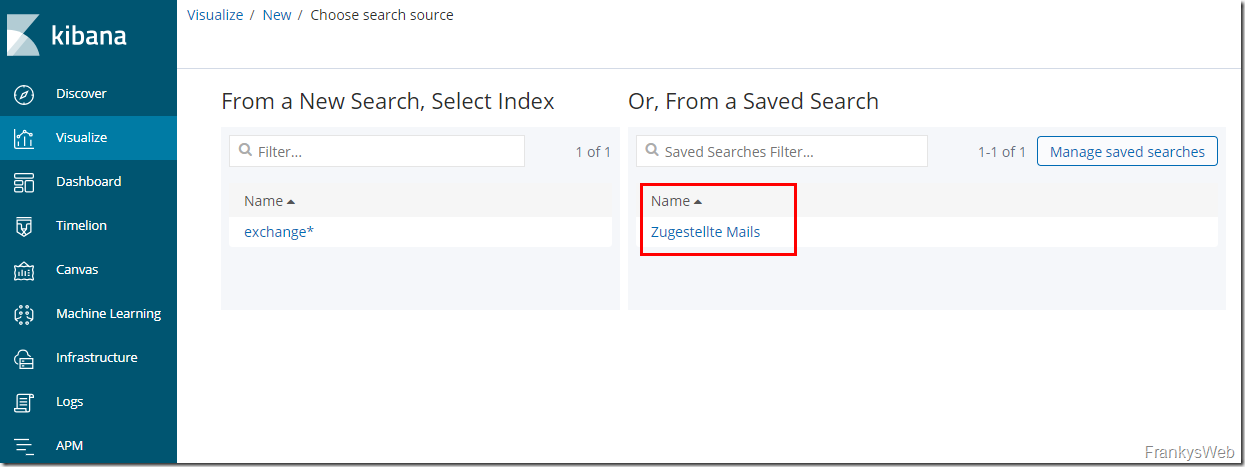
A visualization can now be created from the previously saved search:
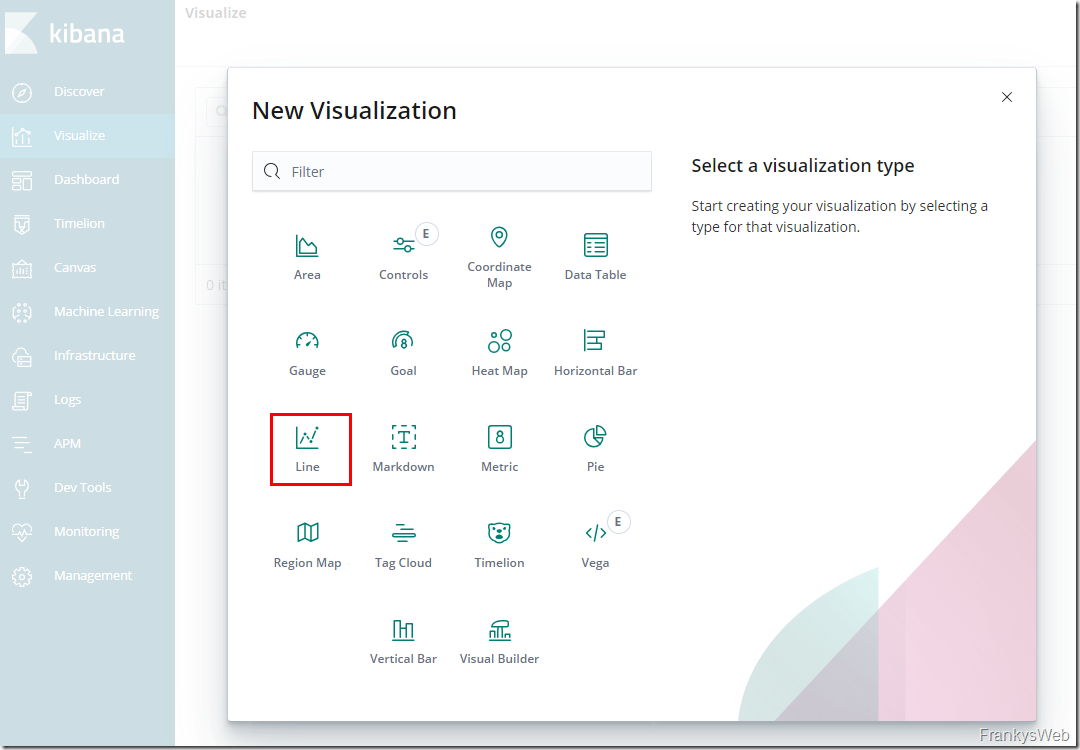
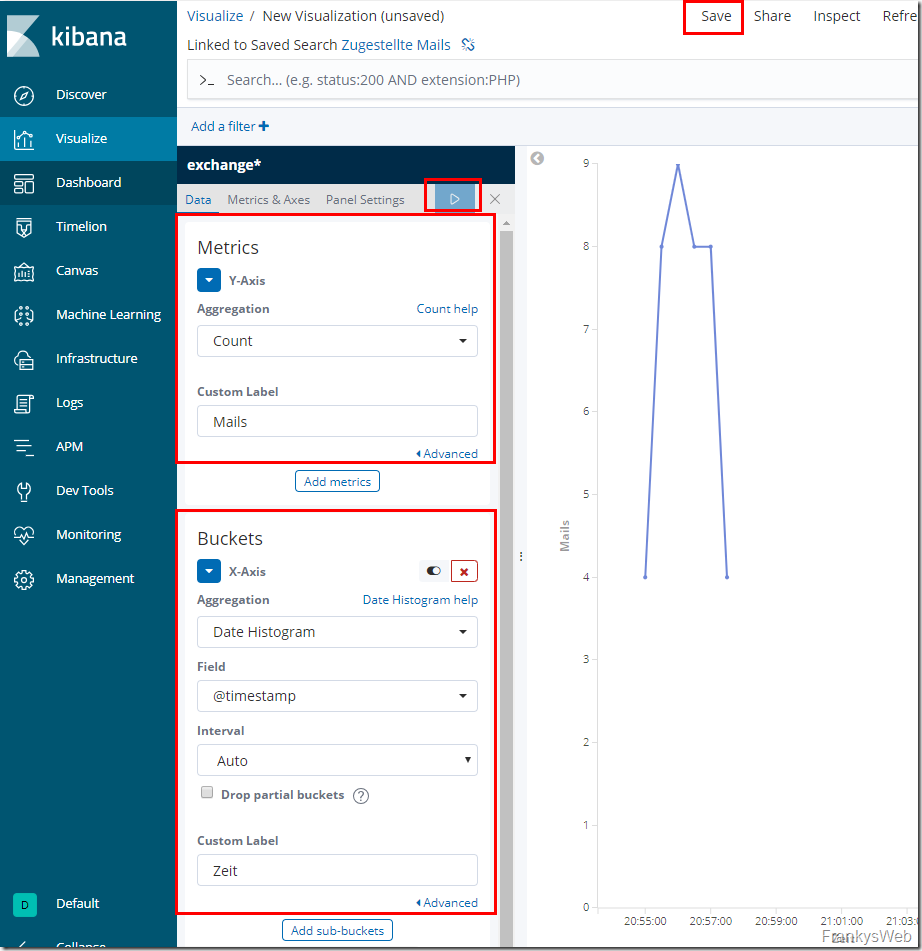
For example, a line chart is suitable for the search "Delivered mails". The line chart then shows the number of delivered mails on the time axis:
The saved search "Delivered mails" can now be used as the data source for the line chart:
Metrics (Y-axis) and buckets (X-axis) must be configured to display the number of emails on a timeline. In this example, "Count" can be used as the aggregation. Count" is used to count the number of events from the saved "Delivered mails" search.
The counted mails with the EventID "DELIVER" from the search "Delivered mails" can then be displayed using the aggregation "Date Histogram" and the field "@timestamp".
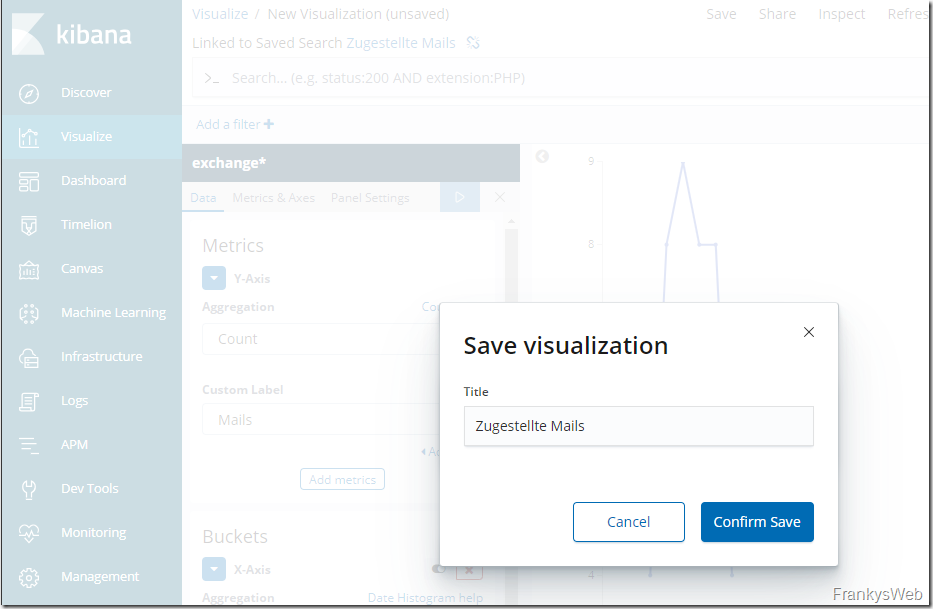
Click on the "Play" button to display the result immediately. The newly created visualization can now also be saved:
The name "Delivered mails" can also be used for the visualization:
Now that the first visualization has been created, it can be displayed on a dashboard.
Create dashboard
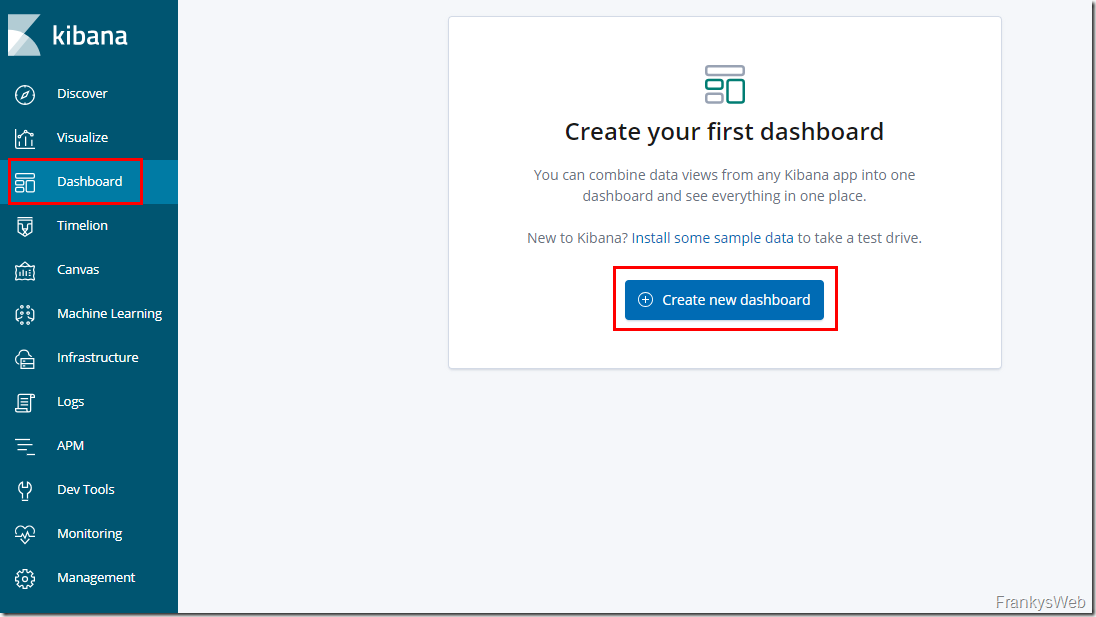
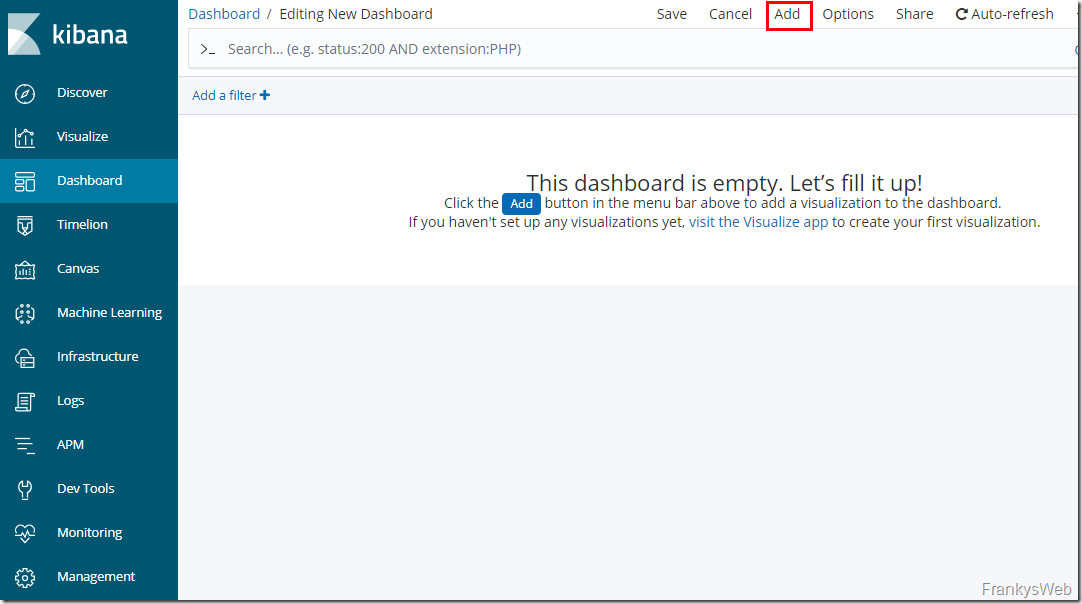
Once a visualization has been created, creating a dashboard is child's play. A new dashboard can be created in the "Dashboard" menu item:
Visualizations can be added to the dashboard using "Add":
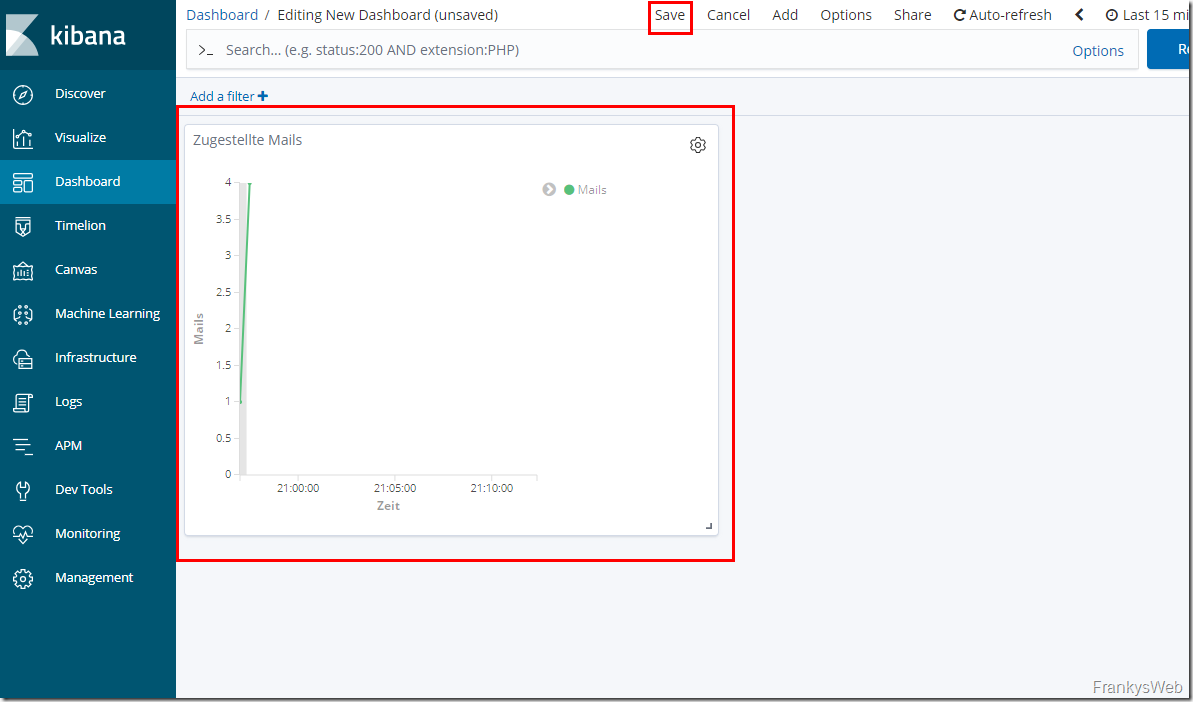
The previously created visualization "Delivered mails" can now be selected and is thus added to the dashboard:
The dashboard now displays the "Delivered mails" visualization and can be saved with "Save":
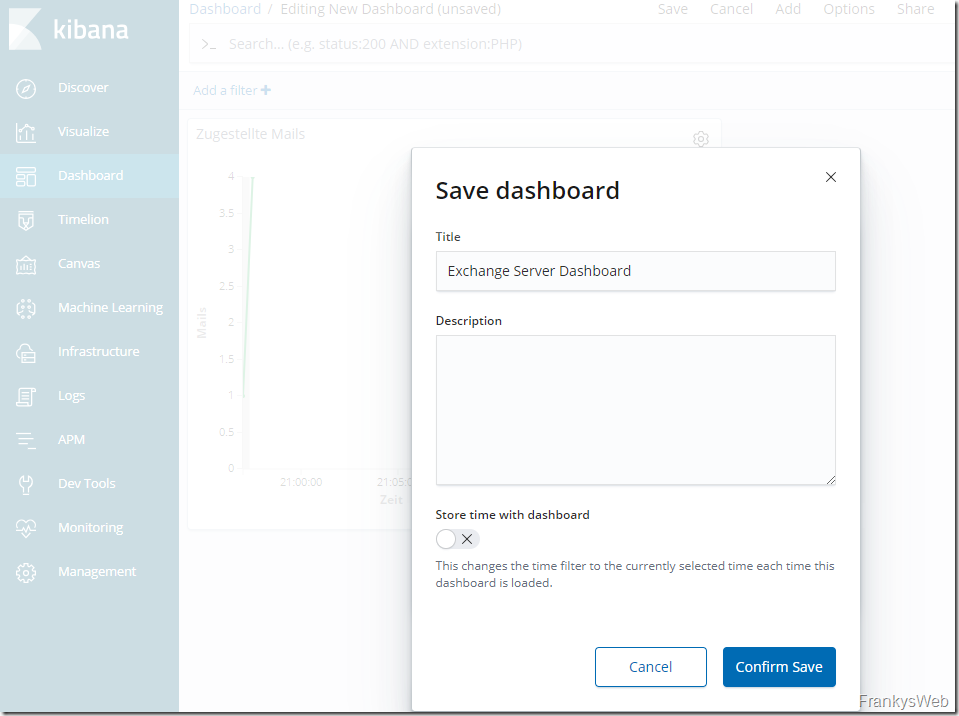
A descriptive name can also be used here, for example "Exchange Server Dashboard":
The display of the dashboard now depends on the selected time period and can also be updated automatically. The display in "Full Screen" mode can also be activated:
Only one visualization is currently displayed on the dashboard; additional searches and visualizations can be created to display more data.
The next article deals with further examples of corresponding searches and visualizations.
