A long time ago I had a little script (Exchange Monitor), which enables a very rudimentary monitoring of Exchange servers. However, the script no longer works with the current Exchange Server versions. I had actually planned to revise the script or I had already experimented with a revised version. Unfortunately, the first test version did not become a finished version, as I quickly realized that I could hardly spend the time necessary to publish a finished version on my own. But you don't always have to reinvent the wheel, after all there are some tools that are easy to use and even free. So here is a series of articles with two different solutions for monitoring Exchange servers.
The first parts of this article series will cover PRTG from the Company Paessler. Paessler offers a freeware version of PRTG that supports up to 100 sensors. The 100 sensors are sufficient for monitoring an Exchange server and a domain controller, and there is even room for a few more components. PRTG is a fully-fledged monitoring solution, which is of course not limited to Exchange Server. It is also quite easy to create your own PRTG sensors using PowerShell, for example. If more than 100 sensors are required, PRTG can be expanded for a fee.
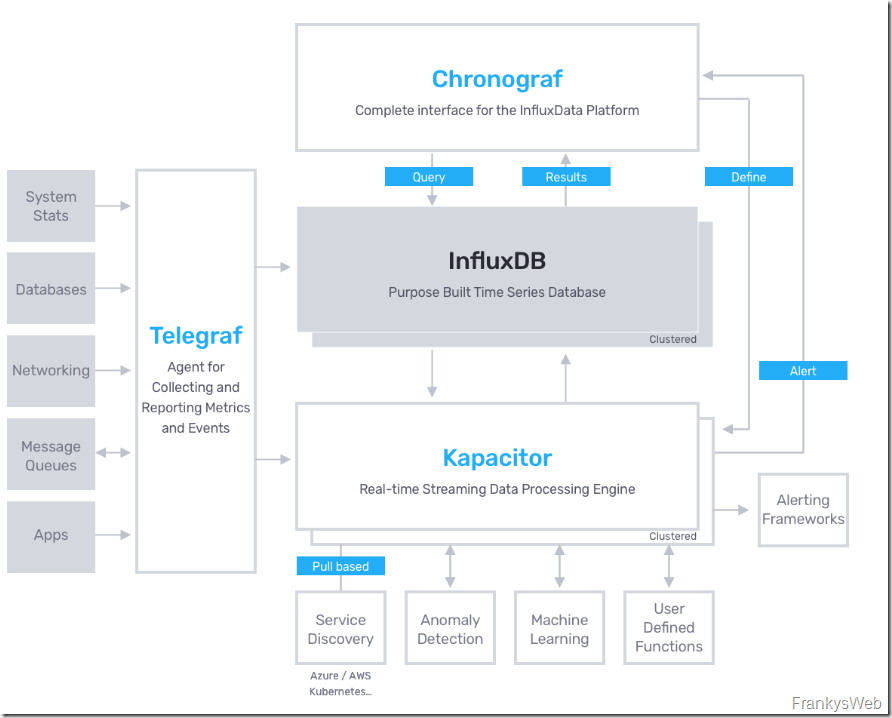
The second solution is the TICK Stack for use. TICK essentially consists of the open source components Telegraf, InfluxDB, Chronograf and Kapacitor. TICK has a higher entry barrier than PRTG, but offers a high degree of flexibility. In addition, modern and attractive dashboards can be created quickly to visualize the data. There is no limit to how many devices or "sensors" can be queried and displayed, so you have to think a little about the presentation.
Of course, there are countless other tools for monitoring servers and applications, but since PRTG and TICK are among my favorite tools, I've decided to write a separate series of articles about them.
Here is a brief overview of the test environment for the "two" tools (strictly speaking, there are 4 tools in TICK).
The test environment consists of a domain controller and an Exchange server. Both servers are running the Windows Server 2019 operating system and the 2019 version of Exchange is also installed. The first part of this article series is about PRTG, so there is an additional Server 2019 for PRTG here. I will spare you a graphical representation at this point, as we are only talking about a few systems here.
The first articles on PRTG will follow in the next few days, then it's TICK's turn.


Offiziel wird Exchange 2019 von PRTG bis Dato leider nicht supported :/ alle verfügbaren Sensoren sind nur bis Exchange 2016 verwendbar. Der Support bestätigte dies leider.
Das Thema Monitoring geht weit über Exchange hinaus. Wer evtl bereits ein anders Monitoring Tool einsetzt sollte am besten gucken wie man dort den Exchange einbindet. Wir nutzen CheckMK und haben irgendwann bemerkt das es extra Plugins für Exchange gibt :-)