I have already carried out a speed comparison between ReFS and NTFS.
- Exchange 2016: Testing storage performance with Jetstress (comparison of NTFS to ReFS) Part 1
- Exchange 2016: Testing storage performance with Jetstress (comparison of NTFS to ReFS) Part 2
- Exchange 2016: Testing storage performance with Jetstress (comparison of NTFS to ReFS) Part 3
However, I carried out the test in 2015 with Windows Server 2012 R2. An update is therefore necessary...
Foreword
Now it's time to repeat the test with Windows Server 2016. The test setup has changed slightly compared to 2015. For the comparison between ReFS and NTFS, I installed a Windows Server 2016 VM on ESXi 6.0 U2 Server.
The ESXi server has 2 x Xeon E5-2690v4 CPUs and 256 GB RAM. The Windows Server 2016 VM has 32 GB RAM, 8 vCPUs and 2 x 200 GB storage for the tests. The ESXi server accesses a DellEMC XtremIO AllFlash Array via 2 x 16 GBit FibreChannel (1 X-Brick). The two 200 GB disks of the VM are located on the same XtremIO LUN.
ESXi has been optimized for the XtremIO and has the latest PowerPath version. All current firmwares, drivers and patches of all systems involved are installed.
As this is a newly implemented system, the setup has to be tested anyway, so in this case I can also directly perform the current comparison between ReFS and NTFS. It's not every day that you have a virgin environment with no other workloads running on it.
So in this case it's: One VM, one array, two file systems, show us what you can do!
Comparison with IOMeter
First of all, a test with IOMeter against a disk that does not contain a file system, i.e. the disk from the XtremIO LUN is only attached to the Windows VM but not formatted. This serves as a reference value for the speed comparison between ReFS and NTFS.
Disk without file system
IOMeter reports just over 140,000 IOPS against the unformatted disk:
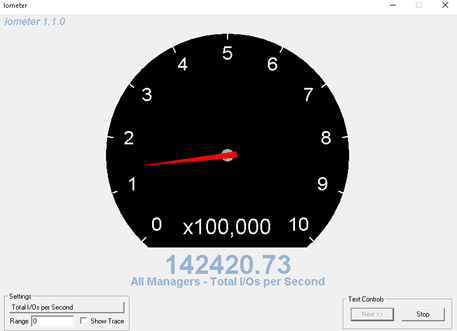
The XtremIO GUI provides similar values:
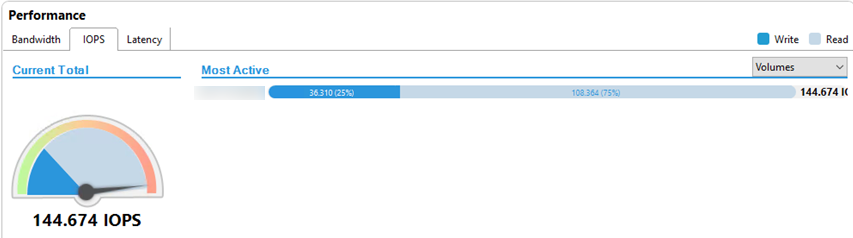
Testing was carried out with 4K blocks, 75 % read and 25 % write.
NTFS
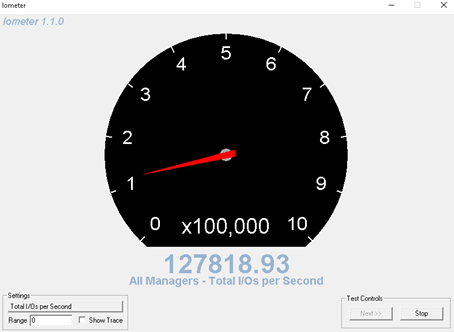
The same IOMeter configuration now against a disk formatted with the NTFS file system. Here it is 127,000 IOPS:
The XtremIO GUI again reports similar values. Here you can see the IOMeter configuration quite well, exactly 25 % write and 75 % read:

ReFS (without FileIntegrity)
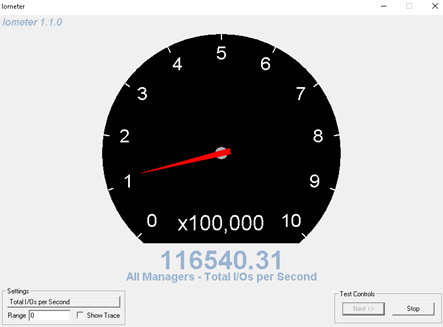
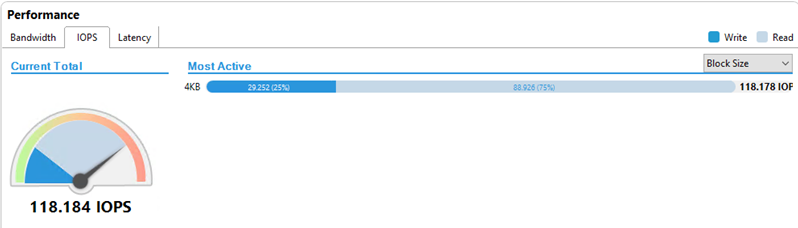
Again the same IOMeter configuration against a disk formatted with ReFS. The ReFS feature "FileIntegrity" is not active. IOMeter reports 116,000 IOPS:
For comparison again the XtremIO GUI with similar values:
ReFS (with FileIntegrity)
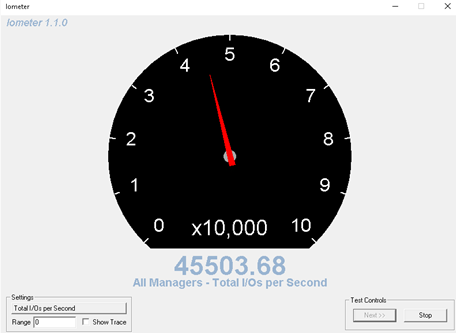
Again the same configuration, but this time with ReFS and FileIntegrity. IOMeter reports 45,000 IOPS:
Something interesting is happening here from a storage perspective:
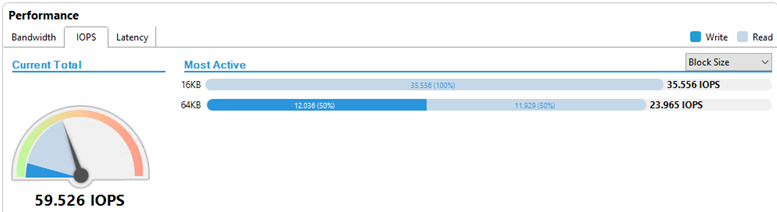
The storage no longer receives 4K IOs, but 16K and 64K IOs. Without FileIntegrity, only 4K IOs were visible here. IOMeter is still set to 75% read and 25 % write, but 50% write IOs are now visible on the storage for the 64K IOs.
The results as a table
For a better overview, here are the results as a table:
| without file system | NTFS | ReFS (without FileIntegrity) | ReFS (with FileIntegrity) | |
| IOMeter | 142420 | 127818 | 116540 | 45503 |
| XtremIO | 144674 | 129144 | 118184 | 59526 |
Conclusion
With NTFS as the file system, just over 127000 IOs can be processed by the storage per second. With ReFS without the FileIntegrity feature, it is a good 10,000 IOs less. NTFS is therefore ahead in a pure throughput comparison. It gets bitter with the FileIntegrity feature switched on, then only 45000 IOs are processed. The fact that the IO throughput is so massively reduced in this case is due to the size of the IOs that are sent to the storage; instead of 4K, the IOs are now 16K and 64K in size.
In the second part, I will test the two file systems again with Jetstress. Let's see if the values are reflected there. Incidentally, the NTFS and ReFS drives were already formatted with 64K allocation units (block size) with regard to Jetstress. I will repeat the test with 4K allocation units and then add to this table.
Servus Frank,
wie sieht das unter 2019 aus?
Wir stehen aktuell vor dieser Entscheidung.
Grüße
Daniel
Hi Franky,
mich würde die Raidconfig im Testscenario noch interessieren. Die Hardwarekonfiguration kann ja schon einen erheblichen Teil ausmachen.
Gruß
Carsten
Hi Carsten,
Beim Storage Array handelt es sich um eine Dell/EMC XtremIO, die XtremIO verwendet kein klassisches RAID, sondern eine eigene Implementierung (XDP). Details finden sich hier:
https://www.emc.com/collateral/white-paper/h13036-wp-xtremio-data-protection.pdf
Gruß,
Frank
Hallo!
Müsste man beim letzten Test nicht die 16k Blöcke durch4 teilen und die 64k durch 16, damit man auf die gleiche Datenmenge wie bei 4k Blöcken kommt?
35556 16k Blöcke pro Sekunde sollten doch der Datenmenge von 142224 4k Blöcken entsprechen, oder habe ich da etwas komplett falsch verstanden?