In a somewhat older article, I have already referred to InfluxDB, Grafana and Telegraf pointed out. Grafana makes it easy to create attractive dashboards for all kinds of systems. The three tools mentioned are often used for the dashboards, InfluxDB as a database for storing the metrics, Grafana and displaying the dashboards and Telegraf to send the data from all conceivable systems to InfluxDB.
Exchange servers write quite a lot of performance data and statistics to Windows Performance Counter. This data is quite suitable for creating a dashboard on the status of the Exchange Server. For some time now, I have been using the following Telegraf for Exchange Server 2016 to send the performance data to an InfluxDB. If anyone can also use the configuration, you can download it here:
Only the parameters for the InfluxDB output plugin need to be adjusted in the configuration file:
Only a few adjustments are also required for Exchange 2019, for example to the "inputs.win_services" input plugin.
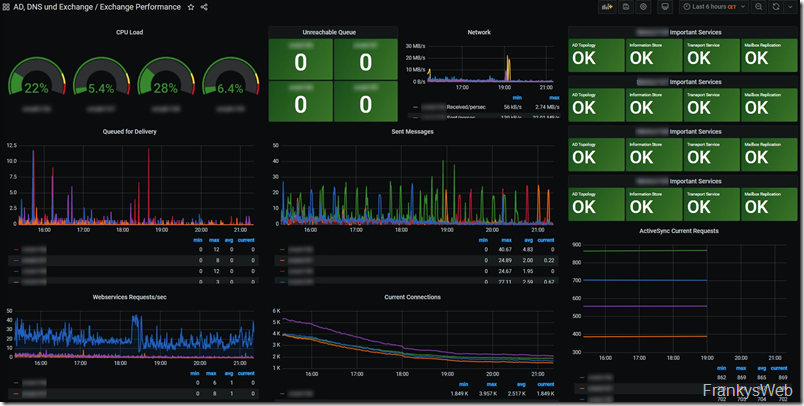
As soon as the performance counter data is stored in the InfluxDB, any Exchange dashboard can be generated from the data. Here is a small example:
This dashboard is only an example and contains only a part of the available data which is sent to Influx via telegraph. With little effort, either very detailed monitoring for Exchange or dashboards for specific statistics can be implemented. For example, the available data could be used to create statistics and forecasts for planning storage requirements. This makes it a little easier for a future migration, as you can also access historical data.


